Hispanic or Latino vs Central American Indian Unemployment Among Ages 55 to 59 years
COMPARE
Hispanic or Latino
Central American Indian
Unemployment Among Ages 55 to 59 years
Unemployment Among Ages 55 to 59 years Comparison
Hispanics or Latinos
Central American Indians
5.4%
UNEMPLOYMENT AMONG AGES 55 TO 59 YEARS
0.0/ 100
METRIC RATING
298th/ 347
METRIC RANK
5.6%
UNEMPLOYMENT AMONG AGES 55 TO 59 YEARS
0.0/ 100
METRIC RATING
313th/ 347
METRIC RANK
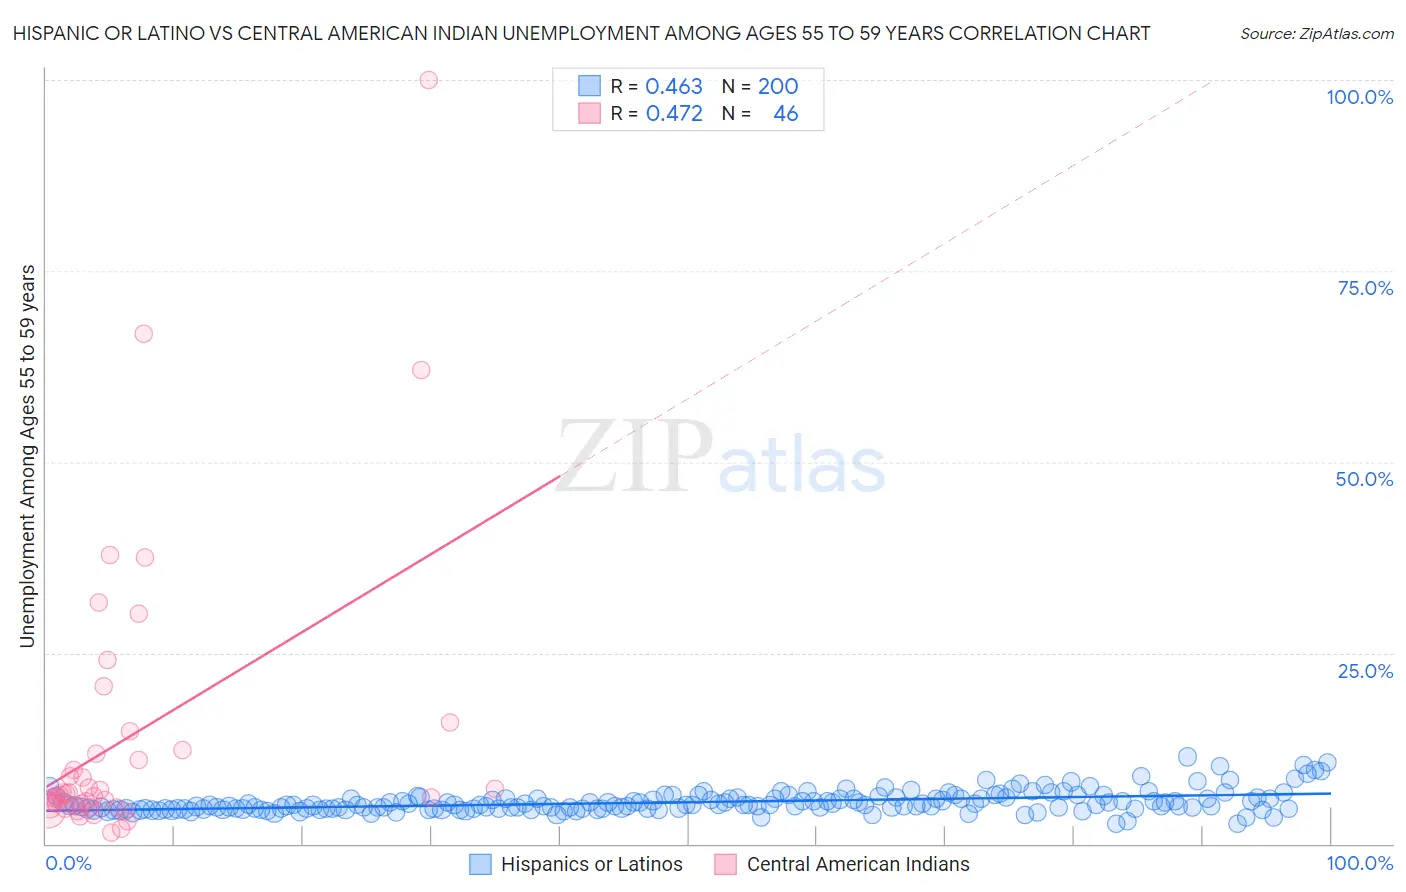
Hispanic or Latino vs Central American Indian Unemployment Among Ages 55 to 59 years Correlation Chart
The statistical analysis conducted on geographies consisting of 491,082,633 people shows a moderate positive correlation between the proportion of Hispanics or Latinos and unemployment rate among population between the ages 55 and 59 in the United States with a correlation coefficient (R) of 0.463 and weighted average of 5.4%. Similarly, the statistical analysis conducted on geographies consisting of 309,997,703 people shows a moderate positive correlation between the proportion of Central American Indians and unemployment rate among population between the ages 55 and 59 in the United States with a correlation coefficient (R) of 0.472 and weighted average of 5.6%, a difference of 5.2%.
Unemployment Among Ages 55 to 59 years Correlation Summary
| Measurement | Hispanic or Latino | Central American Indian |
| Minimum | 2.6% | 1.4% |
| Maximum | 11.4% | 100.0% |
| Range | 8.7% | 98.6% |
| Mean | 5.4% | 14.2% |
| Median | 5.1% | 6.5% |
| Interquartile 25% (IQ1) | 4.6% | 4.9% |
| Interquartile 75% (IQ3) | 5.9% | 12.2% |
| Interquartile Range (IQR) | 1.4% | 7.3% |
| Standard Deviation (Sample) | 1.4% | 19.3% |
| Standard Deviation (Population) | 1.4% | 19.1% |
Demographics Similar to Hispanics or Latinos and Central American Indians by Unemployment Among Ages 55 to 59 years
In terms of unemployment among ages 55 to 59 years, the demographic groups most similar to Hispanics or Latinos are Immigrants from Mexico (5.3%, a difference of 0.38%), Barbadian (5.3%, a difference of 0.60%), Dutch West Indian (5.3%, a difference of 0.64%), Cape Verdean (5.4%, a difference of 1.2%), and Immigrants from St. Vincent and the Grenadines (5.4%, a difference of 1.3%). Similarly, the demographic groups most similar to Central American Indians are Ecuadorian (5.6%, a difference of 0.19%), Tlingit-Haida (5.7%, a difference of 0.29%), Houma (5.6%, a difference of 0.41%), Guyanese (5.7%, a difference of 0.44%), and Belizean (5.6%, a difference of 0.58%).
| Demographics | Rating | Rank | Unemployment Among Ages 55 to 59 years |
| Dutch West Indians | 0.0 /100 | #295 | Tragic 5.3% |
| Barbadians | 0.0 /100 | #296 | Tragic 5.3% |
| Immigrants | Mexico | 0.0 /100 | #297 | Tragic 5.3% |
| Hispanics or Latinos | 0.0 /100 | #298 | Tragic 5.4% |
| Cape Verdeans | 0.0 /100 | #299 | Tragic 5.4% |
| Immigrants | St. Vincent and the Grenadines | 0.0 /100 | #300 | Tragic 5.4% |
| Immigrants | Dominica | 0.0 /100 | #301 | Tragic 5.5% |
| Sierra Leoneans | 0.0 /100 | #302 | Tragic 5.5% |
| Marshallese | 0.0 /100 | #303 | Tragic 5.5% |
| Blacks/African Americans | 0.0 /100 | #304 | Tragic 5.5% |
| Immigrants | Portugal | 0.0 /100 | #305 | Tragic 5.5% |
| Immigrants | Cabo Verde | 0.0 /100 | #306 | Tragic 5.5% |
| Immigrants | Belize | 0.0 /100 | #307 | Tragic 5.5% |
| Spanish American Indians | 0.0 /100 | #308 | Tragic 5.6% |
| Nepalese | 0.0 /100 | #309 | Tragic 5.6% |
| Belizeans | 0.0 /100 | #310 | Tragic 5.6% |
| Houma | 0.0 /100 | #311 | Tragic 5.6% |
| Ecuadorians | 0.0 /100 | #312 | Tragic 5.6% |
| Central American Indians | 0.0 /100 | #313 | Tragic 5.6% |
| Tlingit-Haida | 0.0 /100 | #314 | Tragic 5.7% |
| Guyanese | 0.0 /100 | #315 | Tragic 5.7% |