Hawaiian vs Immigrants from Denmark Unemployment Among Ages 20 to 24 years
COMPARE
Hawaiian
Immigrants from Denmark
Unemployment Among Ages 20 to 24 years
Unemployment Among Ages 20 to 24 years Comparison
Hawaiians
Immigrants from Denmark
10.4%
UNEMPLOYMENT AMONG AGES 20 TO 24 YEARS
33.9/ 100
METRIC RATING
189th/ 347
METRIC RANK
10.4%
UNEMPLOYMENT AMONG AGES 20 TO 24 YEARS
22.8/ 100
METRIC RATING
197th/ 347
METRIC RANK
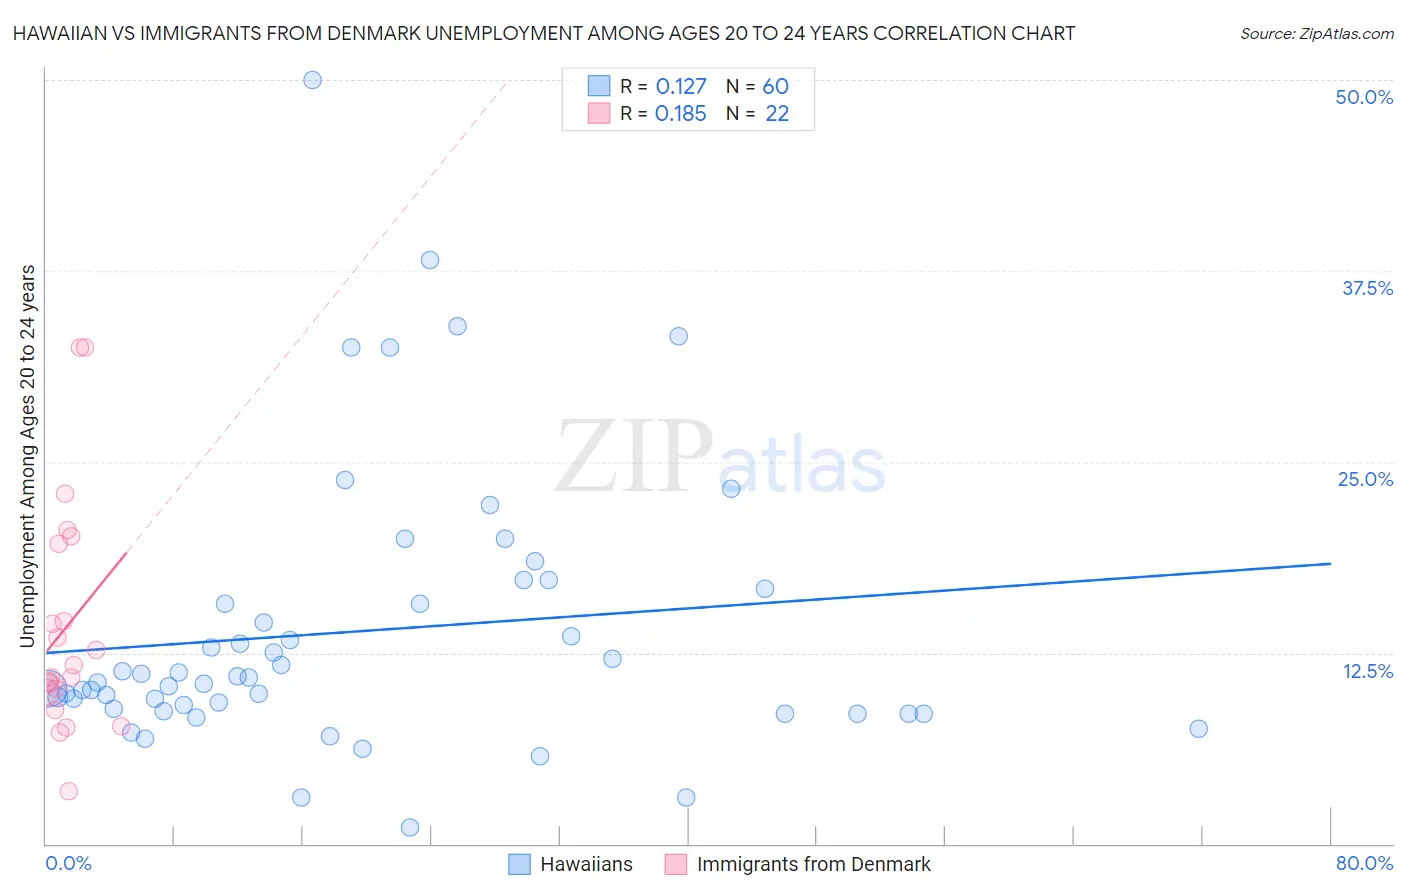
Hawaiian vs Immigrants from Denmark Unemployment Among Ages 20 to 24 years Correlation Chart
The statistical analysis conducted on geographies consisting of 319,397,214 people shows a poor positive correlation between the proportion of Hawaiians and unemployment rate among population between the ages 20 and 24 in the United States with a correlation coefficient (R) of 0.127 and weighted average of 10.4%. Similarly, the statistical analysis conducted on geographies consisting of 134,397,364 people shows a poor positive correlation between the proportion of Immigrants from Denmark and unemployment rate among population between the ages 20 and 24 in the United States with a correlation coefficient (R) of 0.185 and weighted average of 10.4%, a difference of 0.50%.
Unemployment Among Ages 20 to 24 years Correlation Summary
| Measurement | Hawaiian | Immigrants from Denmark |
| Minimum | 1.1% | 3.4% |
| Maximum | 50.0% | 32.5% |
| Range | 48.9% | 29.1% |
| Mean | 13.9% | 14.2% |
| Median | 10.8% | 11.3% |
| Interquartile 25% (IQ1) | 8.8% | 9.9% |
| Interquartile 75% (IQ3) | 16.2% | 19.7% |
| Interquartile Range (IQR) | 7.4% | 9.7% |
| Standard Deviation (Sample) | 9.1% | 7.6% |
| Standard Deviation (Population) | 9.1% | 7.5% |
Demographics Similar to Hawaiians and Immigrants from Denmark by Unemployment Among Ages 20 to 24 years
In terms of unemployment among ages 20 to 24 years, the demographic groups most similar to Hawaiians are Immigrants from Russia (10.4%, a difference of 0.030%), Immigrants from Western Europe (10.4%, a difference of 0.040%), Immigrants from China (10.4%, a difference of 0.050%), Guamanian/Chamorro (10.4%, a difference of 0.060%), and Syrian (10.4%, a difference of 0.070%). Similarly, the demographic groups most similar to Immigrants from Denmark are Colombian (10.4%, a difference of 0.030%), Immigrants from Philippines (10.4%, a difference of 0.060%), Portuguese (10.4%, a difference of 0.060%), Egyptian (10.4%, a difference of 0.080%), and Russian (10.4%, a difference of 0.080%).
| Demographics | Rating | Rank | Unemployment Among Ages 20 to 24 years |
| Immigrants | Egypt | 37.4 /100 | #183 | Fair 10.4% |
| Greeks | 37.2 /100 | #184 | Fair 10.4% |
| Syrians | 35.6 /100 | #185 | Fair 10.4% |
| Guamanians/Chamorros | 35.4 /100 | #186 | Fair 10.4% |
| Immigrants | Western Europe | 35.0 /100 | #187 | Fair 10.4% |
| Immigrants | Russia | 34.6 /100 | #188 | Fair 10.4% |
| Hawaiians | 33.9 /100 | #189 | Fair 10.4% |
| Immigrants | China | 32.6 /100 | #190 | Fair 10.4% |
| Immigrants | Eastern Europe | 25.8 /100 | #191 | Fair 10.4% |
| Ugandans | 25.7 /100 | #192 | Fair 10.4% |
| Immigrants | Portugal | 25.3 /100 | #193 | Fair 10.4% |
| Immigrants | Italy | 25.0 /100 | #194 | Fair 10.4% |
| Egyptians | 24.5 /100 | #195 | Fair 10.4% |
| Immigrants | Philippines | 24.1 /100 | #196 | Fair 10.4% |
| Immigrants | Denmark | 22.8 /100 | #197 | Fair 10.4% |
| Colombians | 22.3 /100 | #198 | Fair 10.4% |
| Portuguese | 21.8 /100 | #199 | Fair 10.4% |
| Russians | 21.2 /100 | #200 | Fair 10.4% |
| Immigrants | Peru | 21.2 /100 | #201 | Fair 10.4% |
| Immigrants | Middle Africa | 20.9 /100 | #202 | Fair 10.4% |
| South Americans | 20.6 /100 | #203 | Fair 10.4% |