Immigrants from Brazil vs Nepalese Unemployment Among Women with Children Under 6 years
COMPARE
Immigrants from Brazil
Nepalese
Unemployment Among Women with Children Under 6 years
Unemployment Among Women with Children Under 6 years Comparison
Immigrants from Brazil
Nepalese
7.5%
UNEMPLOYMENT AMONG WOMEN WITH CHILDREN UNDER 6 YEARS
77.3/ 100
METRIC RATING
148th/ 347
METRIC RANK
7.7%
UNEMPLOYMENT AMONG WOMEN WITH CHILDREN UNDER 6 YEARS
43.5/ 100
METRIC RATING
182nd/ 347
METRIC RANK
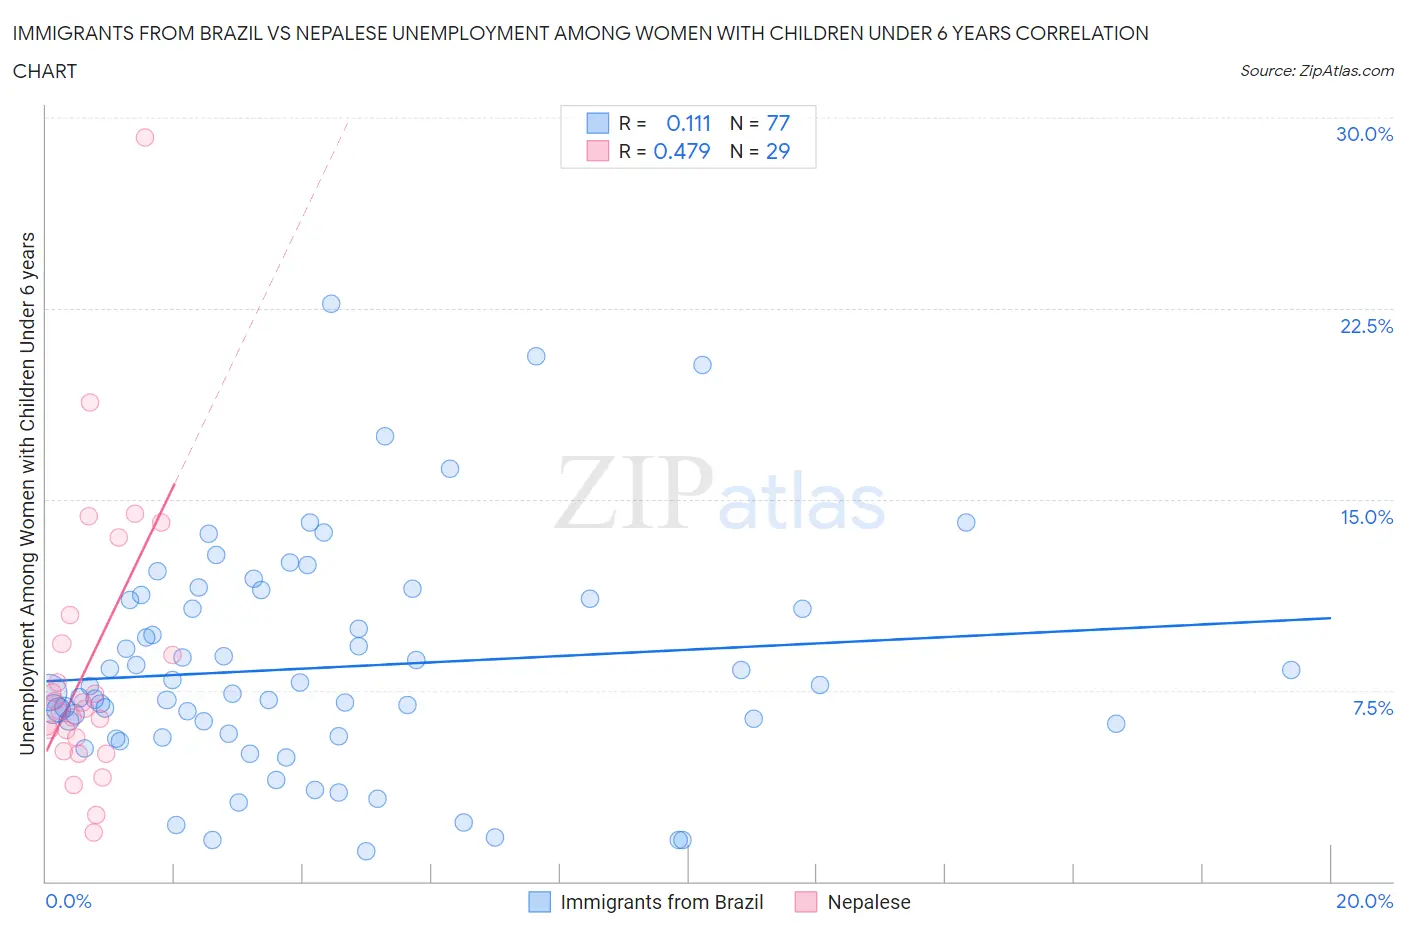
Immigrants from Brazil vs Nepalese Unemployment Among Women with Children Under 6 years Correlation Chart
The statistical analysis conducted on geographies consisting of 268,259,318 people shows a poor positive correlation between the proportion of Immigrants from Brazil and unemployment rate among women with children under the age of 6 in the United States with a correlation coefficient (R) of 0.111 and weighted average of 7.5%. Similarly, the statistical analysis conducted on geographies consisting of 22,749,032 people shows a moderate positive correlation between the proportion of Nepalese and unemployment rate among women with children under the age of 6 in the United States with a correlation coefficient (R) of 0.479 and weighted average of 7.7%, a difference of 2.5%.
Unemployment Among Women with Children Under 6 years Correlation Summary
| Measurement | Immigrants from Brazil | Nepalese |
| Minimum | 1.2% | 1.9% |
| Maximum | 22.7% | 29.2% |
| Range | 21.5% | 27.3% |
| Mean | 8.4% | 8.5% |
| Median | 7.4% | 6.8% |
| Interquartile 25% (IQ1) | 5.7% | 5.4% |
| Interquartile 75% (IQ3) | 11.1% | 9.9% |
| Interquartile Range (IQR) | 5.3% | 4.5% |
| Standard Deviation (Sample) | 4.4% | 5.6% |
| Standard Deviation (Population) | 4.4% | 5.5% |
Similar Demographics by Unemployment Among Women with Children Under 6 years
Demographics Similar to Immigrants from Brazil by Unemployment Among Women with Children Under 6 years
In terms of unemployment among women with children under 6 years, the demographic groups most similar to Immigrants from Brazil are Immigrants from Oceania (7.5%, a difference of 0.11%), Colombian (7.5%, a difference of 0.12%), Aleut (7.5%, a difference of 0.12%), Immigrants from Jordan (7.5%, a difference of 0.16%), and Japanese (7.5%, a difference of 0.16%).
| Demographics | Rating | Rank | Unemployment Among Women with Children Under 6 years |
| Greeks | 82.6 /100 | #141 | Excellent 7.4% |
| Immigrants | Argentina | 81.5 /100 | #142 | Excellent 7.5% |
| Koreans | 81.3 /100 | #143 | Excellent 7.5% |
| Europeans | 79.1 /100 | #144 | Good 7.5% |
| Immigrants | Jordan | 78.9 /100 | #145 | Good 7.5% |
| Japanese | 78.9 /100 | #146 | Good 7.5% |
| Immigrants | Oceania | 78.4 /100 | #147 | Good 7.5% |
| Immigrants | Brazil | 77.3 /100 | #148 | Good 7.5% |
| Colombians | 76.1 /100 | #149 | Good 7.5% |
| Aleuts | 76.0 /100 | #150 | Good 7.5% |
| Immigrants | Peru | 74.9 /100 | #151 | Good 7.5% |
| Bangladeshis | 74.8 /100 | #152 | Good 7.5% |
| Uruguayans | 74.7 /100 | #153 | Good 7.5% |
| Northern Europeans | 74.3 /100 | #154 | Good 7.5% |
| South Americans | 74.1 /100 | #155 | Good 7.5% |
Demographics Similar to Nepalese by Unemployment Among Women with Children Under 6 years
In terms of unemployment among women with children under 6 years, the demographic groups most similar to Nepalese are Brazilian (7.7%, a difference of 0.020%), Sierra Leonean (7.7%, a difference of 0.040%), Immigrants from Uruguay (7.7%, a difference of 0.060%), Immigrants from Western Europe (7.7%, a difference of 0.090%), and Immigrants from England (7.7%, a difference of 0.12%).
| Demographics | Rating | Rank | Unemployment Among Women with Children Under 6 years |
| Panamanians | 49.6 /100 | #175 | Average 7.6% |
| Puget Sound Salish | 47.7 /100 | #176 | Average 7.7% |
| Austrians | 46.0 /100 | #177 | Average 7.7% |
| Immigrants | England | 45.4 /100 | #178 | Average 7.7% |
| Immigrants | Western Europe | 44.9 /100 | #179 | Average 7.7% |
| Immigrants | Uruguay | 44.5 /100 | #180 | Average 7.7% |
| Brazilians | 43.9 /100 | #181 | Average 7.7% |
| Nepalese | 43.5 /100 | #182 | Average 7.7% |
| Sierra Leoneans | 42.9 /100 | #183 | Average 7.7% |
| Indonesians | 40.5 /100 | #184 | Average 7.7% |
| Spanish Americans | 39.7 /100 | #185 | Fair 7.7% |
| Yugoslavians | 39.4 /100 | #186 | Fair 7.7% |
| Immigrants | Thailand | 38.5 /100 | #187 | Fair 7.7% |
| Czechoslovakians | 38.4 /100 | #188 | Fair 7.7% |
| Immigrants | Panama | 35.7 /100 | #189 | Fair 7.7% |