Barbadian vs Somali Unemployment Among Women with Children Under 6 years
COMPARE
Barbadian
Somali
Unemployment Among Women with Children Under 6 years
Unemployment Among Women with Children Under 6 years Comparison
Barbadians
Somalis
8.3%
UNEMPLOYMENT AMONG WOMEN WITH CHILDREN UNDER 6 YEARS
0.4/ 100
METRIC RATING
259th/ 347
METRIC RANK
6.9%
UNEMPLOYMENT AMONG WOMEN WITH CHILDREN UNDER 6 YEARS
99.7/ 100
METRIC RATING
62nd/ 347
METRIC RANK
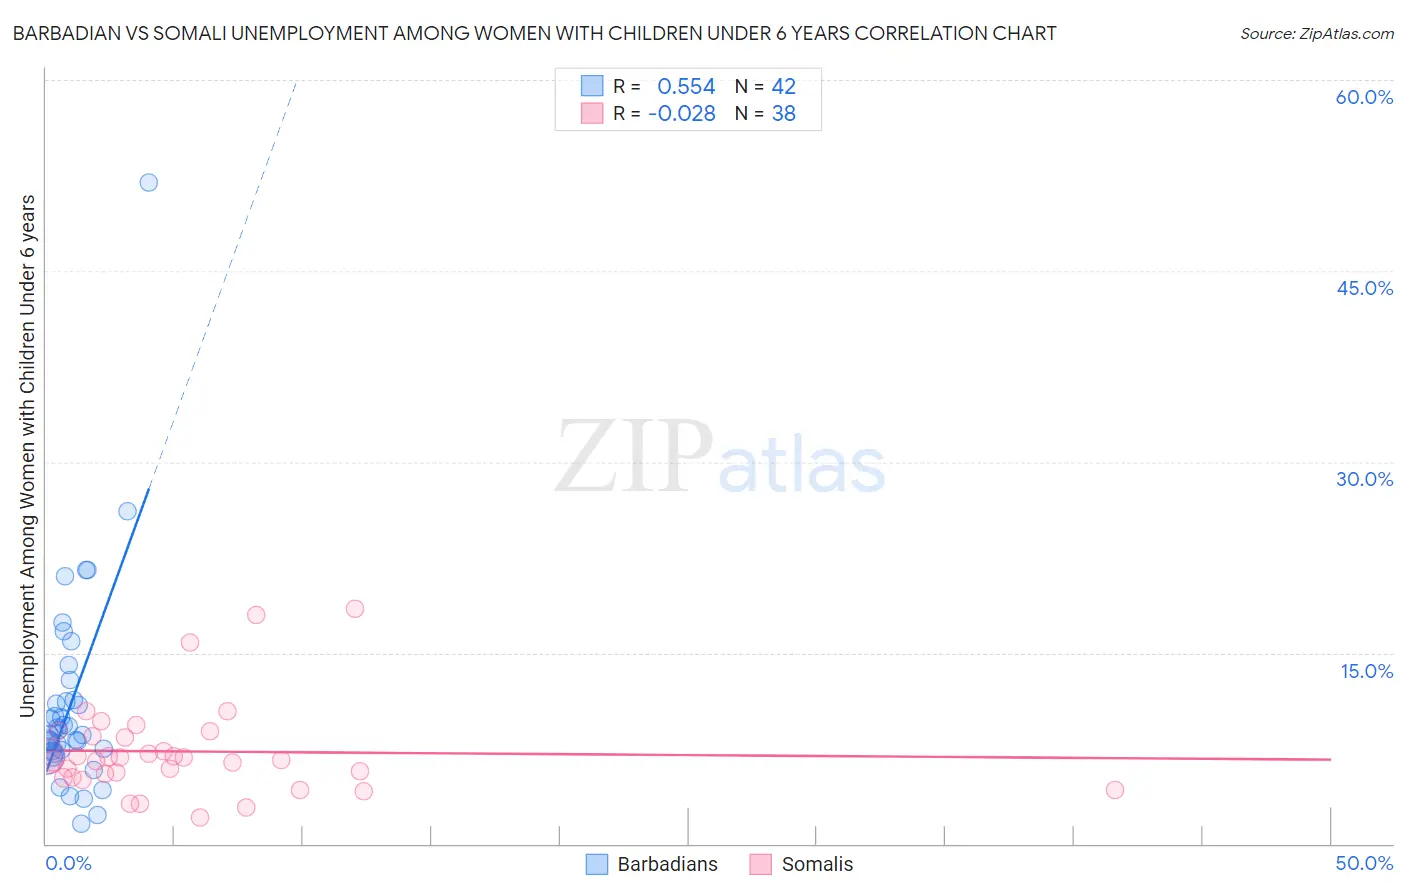
Barbadian vs Somali Unemployment Among Women with Children Under 6 years Correlation Chart
The statistical analysis conducted on geographies consisting of 125,746,302 people shows a substantial positive correlation between the proportion of Barbadians and unemployment rate among women with children under the age of 6 in the United States with a correlation coefficient (R) of 0.554 and weighted average of 8.3%. Similarly, the statistical analysis conducted on geographies consisting of 89,780,147 people shows no correlation between the proportion of Somalis and unemployment rate among women with children under the age of 6 in the United States with a correlation coefficient (R) of -0.028 and weighted average of 6.9%, a difference of 20.8%.
Unemployment Among Women with Children Under 6 years Correlation Summary
| Measurement | Barbadian | Somali |
| Minimum | 1.6% | 2.1% |
| Maximum | 51.9% | 18.5% |
| Range | 50.3% | 16.4% |
| Mean | 11.0% | 7.2% |
| Median | 8.8% | 6.7% |
| Interquartile 25% (IQ1) | 7.3% | 5.2% |
| Interquartile 75% (IQ3) | 11.3% | 8.5% |
| Interquartile Range (IQR) | 4.0% | 3.3% |
| Standard Deviation (Sample) | 8.4% | 3.6% |
| Standard Deviation (Population) | 8.3% | 3.6% |
Similar Demographics by Unemployment Among Women with Children Under 6 years
Demographics Similar to Barbadians by Unemployment Among Women with Children Under 6 years
In terms of unemployment among women with children under 6 years, the demographic groups most similar to Barbadians are White/Caucasian (8.4%, a difference of 0.26%), Immigrants from Ghana (8.3%, a difference of 0.29%), British West Indian (8.3%, a difference of 0.31%), Immigrants from Liberia (8.4%, a difference of 0.54%), and West Indian (8.4%, a difference of 0.55%).
| Demographics | Rating | Rank | Unemployment Among Women with Children Under 6 years |
| Ghanaians | 1.0 /100 | #252 | Tragic 8.2% |
| Immigrants | Guyana | 0.8 /100 | #253 | Tragic 8.2% |
| Immigrants | Caribbean | 0.7 /100 | #254 | Tragic 8.3% |
| Immigrants | Portugal | 0.6 /100 | #255 | Tragic 8.3% |
| Celtics | 0.6 /100 | #256 | Tragic 8.3% |
| British West Indians | 0.5 /100 | #257 | Tragic 8.3% |
| Immigrants | Ghana | 0.5 /100 | #258 | Tragic 8.3% |
| Barbadians | 0.4 /100 | #259 | Tragic 8.3% |
| Whites/Caucasians | 0.3 /100 | #260 | Tragic 8.4% |
| Immigrants | Liberia | 0.3 /100 | #261 | Tragic 8.4% |
| West Indians | 0.3 /100 | #262 | Tragic 8.4% |
| Scotch-Irish | 0.3 /100 | #263 | Tragic 8.4% |
| Hondurans | 0.3 /100 | #264 | Tragic 8.4% |
| French Canadians | 0.3 /100 | #265 | Tragic 8.4% |
| Immigrants | Honduras | 0.3 /100 | #266 | Tragic 8.4% |
Demographics Similar to Somalis by Unemployment Among Women with Children Under 6 years
In terms of unemployment among women with children under 6 years, the demographic groups most similar to Somalis are Immigrants from France (6.9%, a difference of 0.040%), Maltese (6.9%, a difference of 0.050%), Tongan (6.9%, a difference of 0.15%), Immigrants from Kuwait (6.9%, a difference of 0.29%), and Immigrants from Sri Lanka (6.9%, a difference of 0.41%).
| Demographics | Rating | Rank | Unemployment Among Women with Children Under 6 years |
| Immigrants | Ukraine | 99.8 /100 | #55 | Exceptional 6.8% |
| Immigrants | Ethiopia | 99.8 /100 | #56 | Exceptional 6.9% |
| Icelanders | 99.8 /100 | #57 | Exceptional 6.9% |
| Immigrants | Turkey | 99.8 /100 | #58 | Exceptional 6.9% |
| Immigrants | Serbia | 99.8 /100 | #59 | Exceptional 6.9% |
| Immigrants | Sri Lanka | 99.8 /100 | #60 | Exceptional 6.9% |
| Immigrants | France | 99.7 /100 | #61 | Exceptional 6.9% |
| Somalis | 99.7 /100 | #62 | Exceptional 6.9% |
| Maltese | 99.7 /100 | #63 | Exceptional 6.9% |
| Tongans | 99.7 /100 | #64 | Exceptional 6.9% |
| Immigrants | Kuwait | 99.7 /100 | #65 | Exceptional 6.9% |
| Immigrants | Belgium | 99.6 /100 | #66 | Exceptional 6.9% |
| Immigrants | Netherlands | 99.5 /100 | #67 | Exceptional 7.0% |
| Paraguayans | 99.4 /100 | #68 | Exceptional 7.0% |
| Immigrants | Eritrea | 99.4 /100 | #69 | Exceptional 7.0% |