Immigrants from Morocco vs Spanish Unemployment Among Women with Children Under 6 years
COMPARE
Immigrants from Morocco
Spanish
Unemployment Among Women with Children Under 6 years
Unemployment Among Women with Children Under 6 years Comparison
Immigrants from Morocco
Spanish
7.4%
UNEMPLOYMENT AMONG WOMEN WITH CHILDREN UNDER 6 YEARS
84.9/ 100
METRIC RATING
136th/ 347
METRIC RANK
7.9%
UNEMPLOYMENT AMONG WOMEN WITH CHILDREN UNDER 6 YEARS
11.3/ 100
METRIC RATING
214th/ 347
METRIC RANK
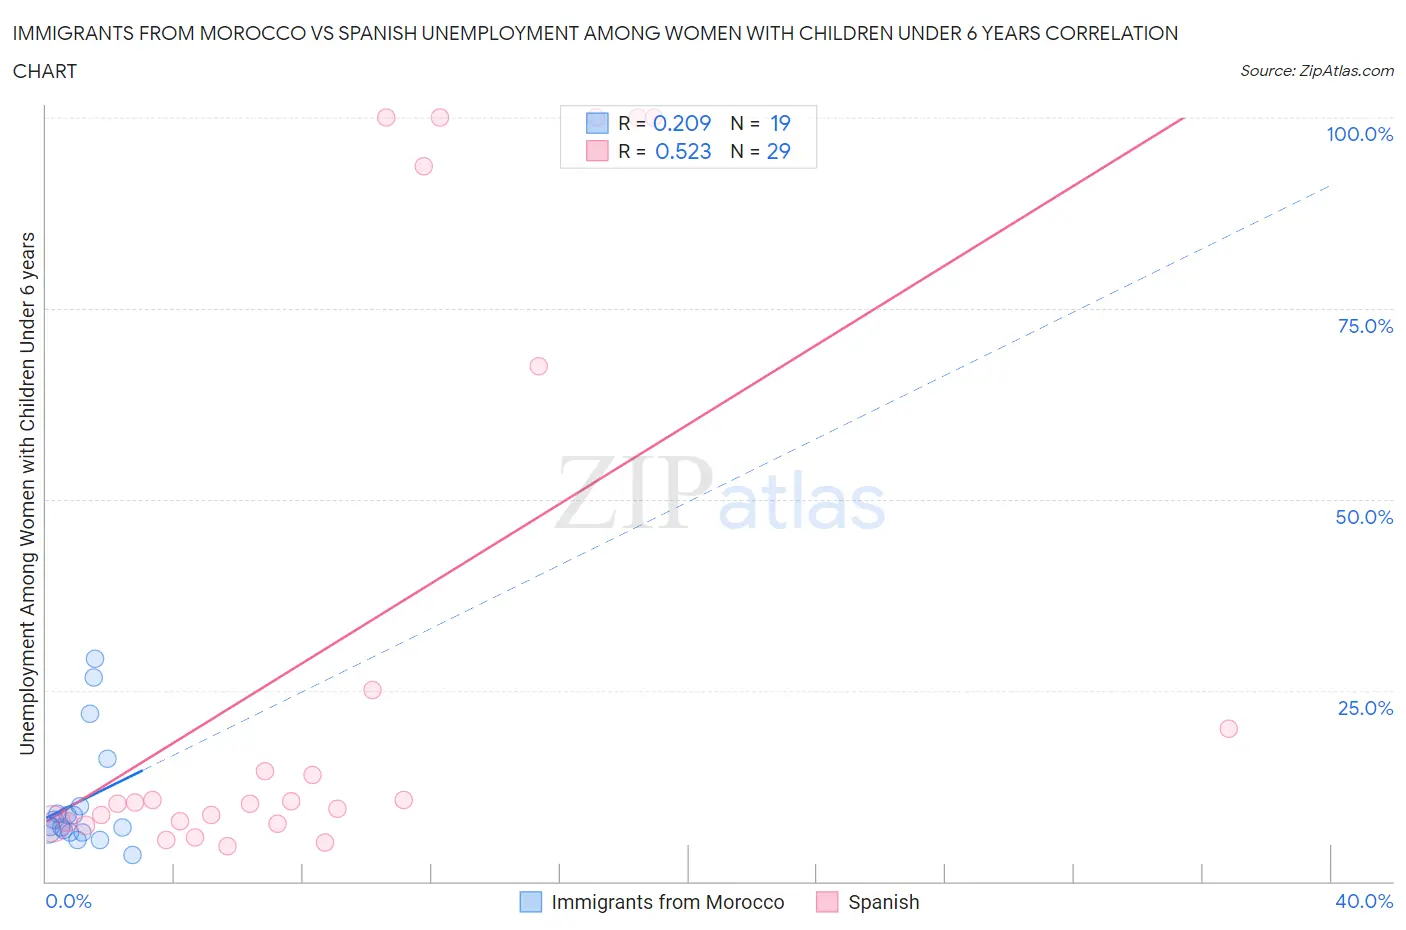
Immigrants from Morocco vs Spanish Unemployment Among Women with Children Under 6 years Correlation Chart
The statistical analysis conducted on geographies consisting of 154,831,336 people shows a weak positive correlation between the proportion of Immigrants from Morocco and unemployment rate among women with children under the age of 6 in the United States with a correlation coefficient (R) of 0.209 and weighted average of 7.4%. Similarly, the statistical analysis conducted on geographies consisting of 316,873,283 people shows a substantial positive correlation between the proportion of Spanish and unemployment rate among women with children under the age of 6 in the United States with a correlation coefficient (R) of 0.523 and weighted average of 7.9%, a difference of 6.5%.
Unemployment Among Women with Children Under 6 years Correlation Summary
| Measurement | Immigrants from Morocco | Spanish |
| Minimum | 3.4% | 4.6% |
| Maximum | 29.2% | 100.0% |
| Range | 25.8% | 95.4% |
| Mean | 10.5% | 30.4% |
| Median | 7.2% | 10.3% |
| Interquartile 25% (IQ1) | 6.4% | 7.6% |
| Interquartile 75% (IQ3) | 9.8% | 46.3% |
| Interquartile Range (IQR) | 3.4% | 38.6% |
| Standard Deviation (Sample) | 7.4% | 37.4% |
| Standard Deviation (Population) | 7.2% | 36.8% |
Similar Demographics by Unemployment Among Women with Children Under 6 years
Demographics Similar to Immigrants from Morocco by Unemployment Among Women with Children Under 6 years
In terms of unemployment among women with children under 6 years, the demographic groups most similar to Immigrants from Morocco are Immigrants from Cambodia (7.4%, a difference of 0.030%), Immigrants from Northern Africa (7.4%, a difference of 0.060%), Immigrants from Norway (7.4%, a difference of 0.11%), Immigrants from Bolivia (7.4%, a difference of 0.12%), and Immigrants from Colombia (7.4%, a difference of 0.13%).
| Demographics | Rating | Rank | Unemployment Among Women with Children Under 6 years |
| Slovenes | 89.2 /100 | #129 | Excellent 7.4% |
| Swedes | 88.4 /100 | #130 | Excellent 7.4% |
| Ukrainians | 88.2 /100 | #131 | Excellent 7.4% |
| Immigrants | Armenia | 87.4 /100 | #132 | Excellent 7.4% |
| Immigrants | Uganda | 86.5 /100 | #133 | Excellent 7.4% |
| Immigrants | Bolivia | 85.7 /100 | #134 | Excellent 7.4% |
| Immigrants | Northern Africa | 85.3 /100 | #135 | Excellent 7.4% |
| Immigrants | Morocco | 84.9 /100 | #136 | Excellent 7.4% |
| Immigrants | Cambodia | 84.6 /100 | #137 | Excellent 7.4% |
| Immigrants | Norway | 84.1 /100 | #138 | Excellent 7.4% |
| Immigrants | Colombia | 83.9 /100 | #139 | Excellent 7.4% |
| Scandinavians | 83.0 /100 | #140 | Excellent 7.4% |
| Greeks | 82.6 /100 | #141 | Excellent 7.4% |
| Immigrants | Argentina | 81.5 /100 | #142 | Excellent 7.5% |
| Koreans | 81.3 /100 | #143 | Excellent 7.5% |
Demographics Similar to Spanish by Unemployment Among Women with Children Under 6 years
In terms of unemployment among women with children under 6 years, the demographic groups most similar to Spanish are Ecuadorian (7.9%, a difference of 0.010%), Scottish (7.9%, a difference of 0.020%), Immigrants from Lebanon (7.9%, a difference of 0.030%), Immigrants from Nigeria (7.9%, a difference of 0.15%), and Swiss (7.9%, a difference of 0.16%).
| Demographics | Rating | Rank | Unemployment Among Women with Children Under 6 years |
| Canadians | 20.6 /100 | #207 | Fair 7.8% |
| Immigrants | Syria | 18.9 /100 | #208 | Poor 7.8% |
| Costa Ricans | 17.6 /100 | #209 | Poor 7.8% |
| Poles | 16.0 /100 | #210 | Poor 7.9% |
| Immigrants | Ecuador | 14.9 /100 | #211 | Poor 7.9% |
| Swiss | 12.3 /100 | #212 | Poor 7.9% |
| Scottish | 11.4 /100 | #213 | Poor 7.9% |
| Spanish | 11.3 /100 | #214 | Poor 7.9% |
| Ecuadorians | 11.2 /100 | #215 | Poor 7.9% |
| Immigrants | Lebanon | 11.1 /100 | #216 | Poor 7.9% |
| Immigrants | Nigeria | 10.3 /100 | #217 | Poor 7.9% |
| Moroccans | 9.7 /100 | #218 | Tragic 7.9% |
| Arabs | 9.4 /100 | #219 | Tragic 7.9% |
| South American Indians | 9.3 /100 | #220 | Tragic 7.9% |
| Immigrants | Germany | 8.5 /100 | #221 | Tragic 7.9% |