Ghanaian vs Macedonian Unemployment
COMPARE
Ghanaian
Macedonian
Unemployment
Unemployment Comparison
Ghanaians
Macedonians
6.0%
UNEMPLOYMENT
0.0/ 100
METRIC RATING
278th/ 347
METRIC RANK
5.1%
UNEMPLOYMENT
89.7/ 100
METRIC RATING
120th/ 347
METRIC RANK
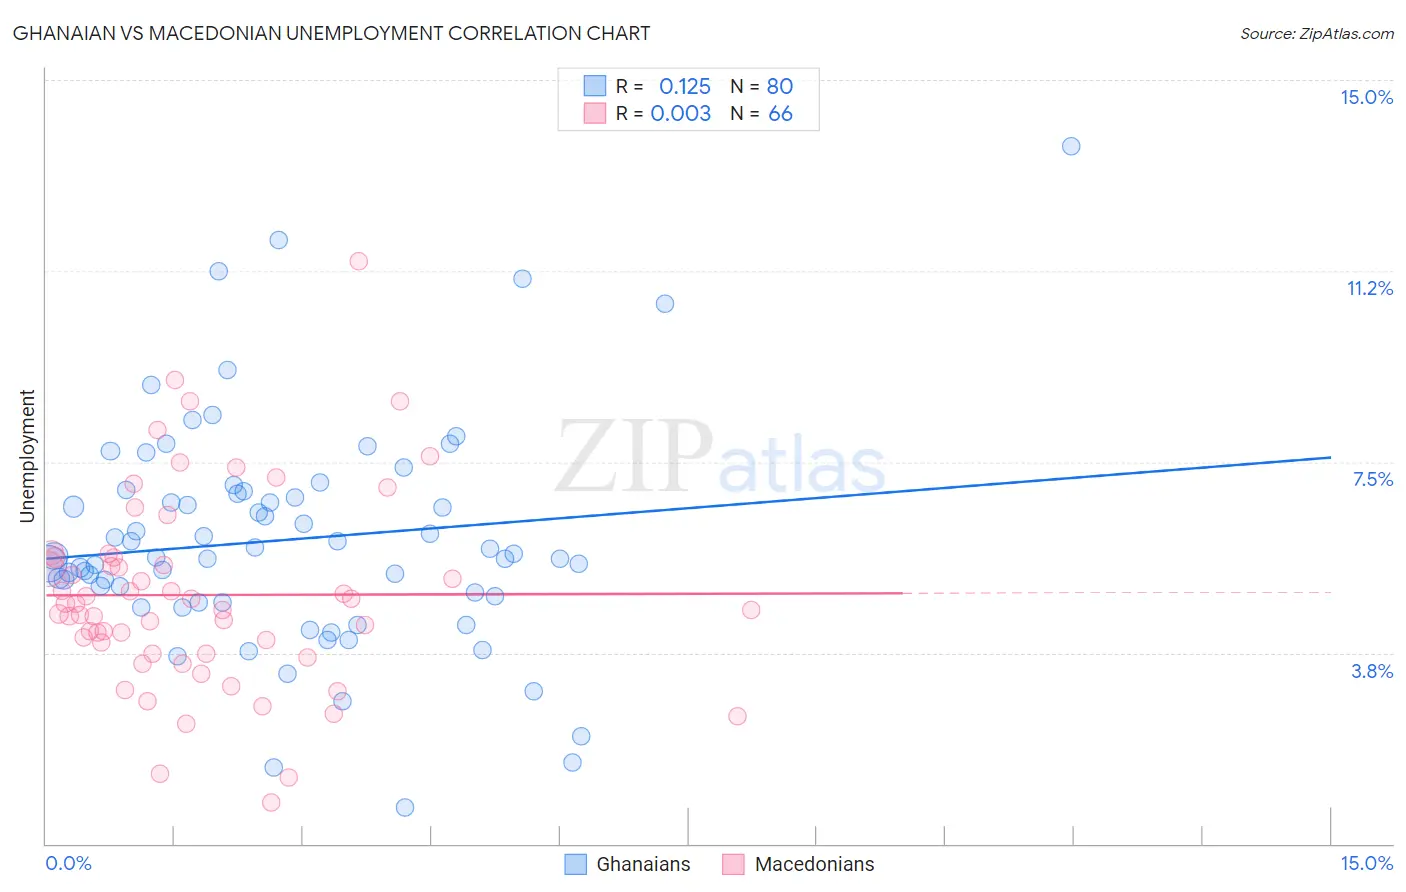
Ghanaian vs Macedonian Unemployment Correlation Chart
The statistical analysis conducted on geographies consisting of 190,676,370 people shows a poor positive correlation between the proportion of Ghanaians and unemployment in the United States with a correlation coefficient (R) of 0.125 and weighted average of 6.0%. Similarly, the statistical analysis conducted on geographies consisting of 132,628,728 people shows no correlation between the proportion of Macedonians and unemployment in the United States with a correlation coefficient (R) of 0.003 and weighted average of 5.1%, a difference of 17.9%.
Unemployment Correlation Summary
| Measurement | Ghanaian | Macedonian |
| Minimum | 0.70% | 0.80% |
| Maximum | 13.7% | 11.4% |
| Range | 13.0% | 10.6% |
| Mean | 6.0% | 4.9% |
| Median | 5.6% | 4.7% |
| Interquartile 25% (IQ1) | 4.8% | 3.7% |
| Interquartile 75% (IQ3) | 6.9% | 5.6% |
| Interquartile Range (IQR) | 2.1% | 1.9% |
| Standard Deviation (Sample) | 2.2% | 1.9% |
| Standard Deviation (Population) | 2.2% | 1.9% |
Similar Demographics by Unemployment
Demographics Similar to Ghanaians by Unemployment
In terms of unemployment, the demographic groups most similar to Ghanaians are Armenian (6.0%, a difference of 0.29%), Immigrants from Mexico (6.0%, a difference of 0.43%), Immigrants from Western Africa (6.0%, a difference of 0.43%), Immigrants from Central America (6.0%, a difference of 0.64%), and Immigrants from Latin America (5.9%, a difference of 0.93%).
| Demographics | Rating | Rank | Unemployment |
| Mexicans | 0.1 /100 | #271 | Tragic 5.9% |
| Hispanics or Latinos | 0.0 /100 | #272 | Tragic 5.9% |
| Immigrants | Fiji | 0.0 /100 | #273 | Tragic 5.9% |
| Bahamians | 0.0 /100 | #274 | Tragic 5.9% |
| Immigrants | Latin America | 0.0 /100 | #275 | Tragic 5.9% |
| Immigrants | Central America | 0.0 /100 | #276 | Tragic 6.0% |
| Armenians | 0.0 /100 | #277 | Tragic 6.0% |
| Ghanaians | 0.0 /100 | #278 | Tragic 6.0% |
| Immigrants | Mexico | 0.0 /100 | #279 | Tragic 6.0% |
| Immigrants | Western Africa | 0.0 /100 | #280 | Tragic 6.0% |
| Africans | 0.0 /100 | #281 | Tragic 6.1% |
| Immigrants | Azores | 0.0 /100 | #282 | Tragic 6.1% |
| Immigrants | Ghana | 0.0 /100 | #283 | Tragic 6.1% |
| Aleuts | 0.0 /100 | #284 | Tragic 6.1% |
| Immigrants | Senegal | 0.0 /100 | #285 | Tragic 6.1% |
Demographics Similar to Macedonians by Unemployment
In terms of unemployment, the demographic groups most similar to Macedonians are Immigrants from France (5.1%, a difference of 0.010%), Lebanese (5.1%, a difference of 0.070%), Immigrants from Switzerland (5.1%, a difference of 0.090%), Asian (5.1%, a difference of 0.11%), and Ethiopian (5.1%, a difference of 0.17%).
| Demographics | Rating | Rank | Unemployment |
| Argentineans | 92.4 /100 | #113 | Exceptional 5.1% |
| Immigrants | Ireland | 92.1 /100 | #114 | Exceptional 5.1% |
| Immigrants | Western Europe | 91.1 /100 | #115 | Exceptional 5.1% |
| Immigrants | Sri Lanka | 91.1 /100 | #116 | Exceptional 5.1% |
| Immigrants | Malaysia | 91.0 /100 | #117 | Exceptional 5.1% |
| Immigrants | Germany | 90.8 /100 | #118 | Exceptional 5.1% |
| Immigrants | France | 89.7 /100 | #119 | Excellent 5.1% |
| Macedonians | 89.7 /100 | #120 | Excellent 5.1% |
| Lebanese | 89.2 /100 | #121 | Excellent 5.1% |
| Immigrants | Switzerland | 89.1 /100 | #122 | Excellent 5.1% |
| Asians | 89.0 /100 | #123 | Excellent 5.1% |
| Ethiopians | 88.6 /100 | #124 | Excellent 5.1% |
| Immigrants | Eastern Asia | 88.3 /100 | #125 | Excellent 5.1% |
| Kenyans | 88.2 /100 | #126 | Excellent 5.1% |
| Immigrants | Kenya | 88.2 /100 | #127 | Excellent 5.1% |