Ghanaian vs Albanian Unemployment Among Women with Children Ages 6 to 17 years
COMPARE
Ghanaian
Albanian
Unemployment Among Women with Children Ages 6 to 17 years
Unemployment Among Women with Children Ages 6 to 17 years Comparison
Ghanaians
Albanians
9.6%
UNEMPLOYMENT AMONG WOMEN WITH CHILDREN AGES 6 TO 17 YEARS
0.2/ 100
METRIC RATING
268th/ 347
METRIC RANK
8.6%
UNEMPLOYMENT AMONG WOMEN WITH CHILDREN AGES 6 TO 17 YEARS
96.3/ 100
METRIC RATING
117th/ 347
METRIC RANK
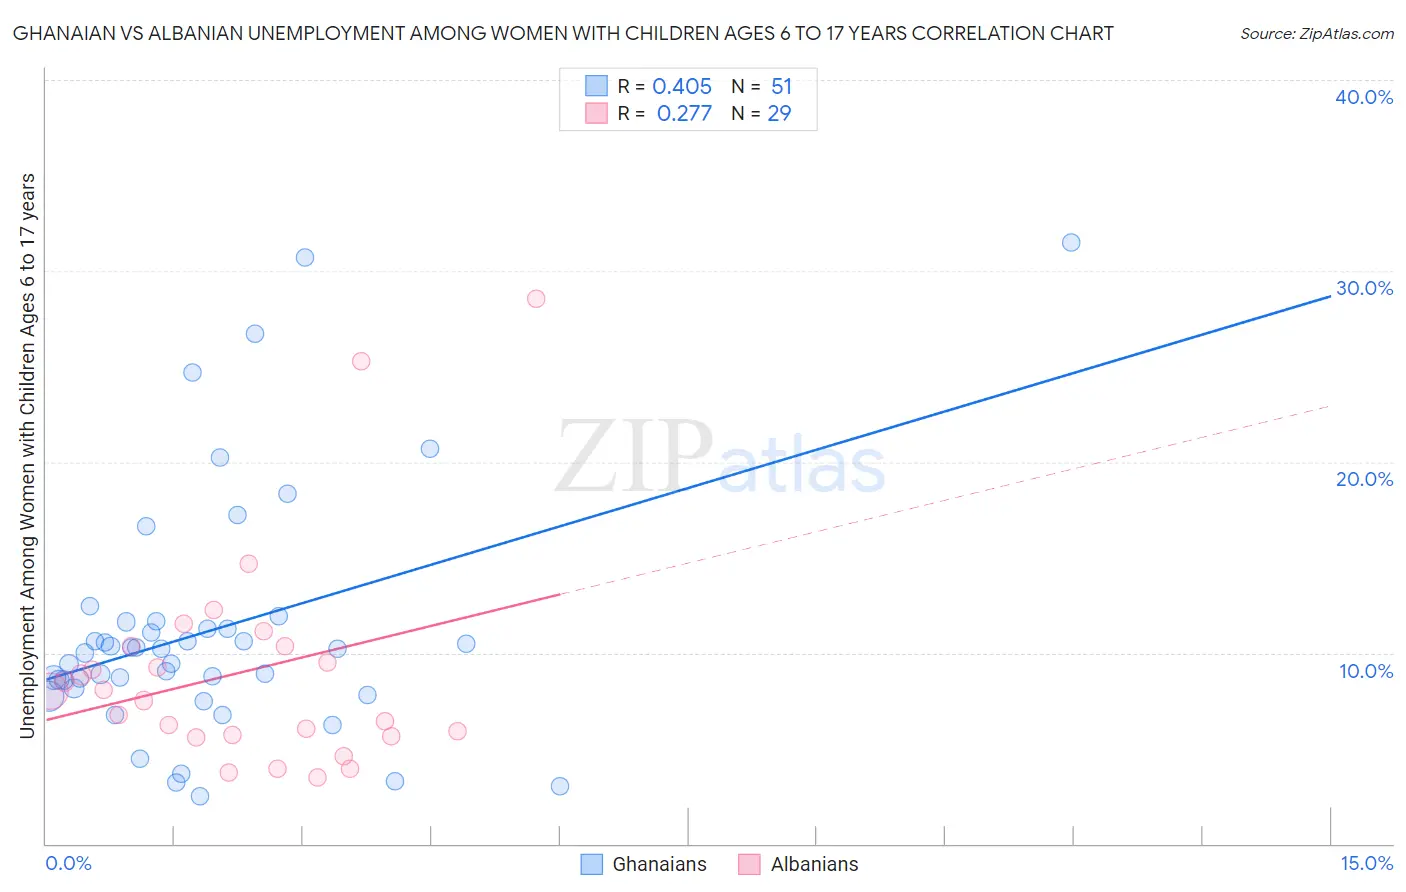
Ghanaian vs Albanian Unemployment Among Women with Children Ages 6 to 17 years Correlation Chart
The statistical analysis conducted on geographies consisting of 158,398,422 people shows a moderate positive correlation between the proportion of Ghanaians and unemployment rate among women with children between the ages 6 and 17 in the United States with a correlation coefficient (R) of 0.405 and weighted average of 9.6%. Similarly, the statistical analysis conducted on geographies consisting of 149,986,101 people shows a weak positive correlation between the proportion of Albanians and unemployment rate among women with children between the ages 6 and 17 in the United States with a correlation coefficient (R) of 0.277 and weighted average of 8.6%, a difference of 10.8%.
Unemployment Among Women with Children Ages 6 to 17 years Correlation Summary
| Measurement | Ghanaian | Albanian |
| Minimum | 2.5% | 3.5% |
| Maximum | 31.5% | 28.5% |
| Range | 29.0% | 25.0% |
| Mean | 11.2% | 9.0% |
| Median | 10.2% | 8.0% |
| Interquartile 25% (IQ1) | 8.1% | 5.6% |
| Interquartile 75% (IQ3) | 11.6% | 10.4% |
| Interquartile Range (IQR) | 3.5% | 4.7% |
| Standard Deviation (Sample) | 6.4% | 5.7% |
| Standard Deviation (Population) | 6.3% | 5.6% |
Similar Demographics by Unemployment Among Women with Children Ages 6 to 17 years
Demographics Similar to Ghanaians by Unemployment Among Women with Children Ages 6 to 17 years
In terms of unemployment among women with children ages 6 to 17 years, the demographic groups most similar to Ghanaians are Blackfeet (9.6%, a difference of 0.080%), Immigrants from Nicaragua (9.6%, a difference of 0.18%), Irish (9.5%, a difference of 0.39%), Immigrants from Jamaica (9.5%, a difference of 0.41%), and West Indian (9.5%, a difference of 0.57%).
| Demographics | Rating | Rank | Unemployment Among Women with Children Ages 6 to 17 years |
| South Americans | 0.5 /100 | #261 | Tragic 9.5% |
| Senegalese | 0.5 /100 | #262 | Tragic 9.5% |
| Lebanese | 0.5 /100 | #263 | Tragic 9.5% |
| Immigrants | Ghana | 0.4 /100 | #264 | Tragic 9.5% |
| West Indians | 0.4 /100 | #265 | Tragic 9.5% |
| Immigrants | Jamaica | 0.3 /100 | #266 | Tragic 9.5% |
| Irish | 0.3 /100 | #267 | Tragic 9.5% |
| Ghanaians | 0.2 /100 | #268 | Tragic 9.6% |
| Blackfeet | 0.2 /100 | #269 | Tragic 9.6% |
| Immigrants | Nicaragua | 0.2 /100 | #270 | Tragic 9.6% |
| Immigrants | Latin America | 0.1 /100 | #271 | Tragic 9.6% |
| Kiowa | 0.1 /100 | #272 | Tragic 9.6% |
| Whites/Caucasians | 0.1 /100 | #273 | Tragic 9.6% |
| Aleuts | 0.1 /100 | #274 | Tragic 9.6% |
| U.S. Virgin Islanders | 0.1 /100 | #275 | Tragic 9.7% |
Demographics Similar to Albanians by Unemployment Among Women with Children Ages 6 to 17 years
In terms of unemployment among women with children ages 6 to 17 years, the demographic groups most similar to Albanians are Zimbabwean (8.6%, a difference of 0.010%), Pueblo (8.6%, a difference of 0.030%), Immigrants from Grenada (8.6%, a difference of 0.040%), Argentinean (8.6%, a difference of 0.080%), and Israeli (8.7%, a difference of 0.12%).
| Demographics | Rating | Rank | Unemployment Among Women with Children Ages 6 to 17 years |
| Latvians | 97.4 /100 | #110 | Exceptional 8.6% |
| Immigrants | Ukraine | 97.4 /100 | #111 | Exceptional 8.6% |
| Romanians | 97.1 /100 | #112 | Exceptional 8.6% |
| Eastern Europeans | 96.8 /100 | #113 | Exceptional 8.6% |
| Immigrants | Russia | 96.7 /100 | #114 | Exceptional 8.6% |
| Argentineans | 96.5 /100 | #115 | Exceptional 8.6% |
| Zimbabweans | 96.3 /100 | #116 | Exceptional 8.6% |
| Albanians | 96.3 /100 | #117 | Exceptional 8.6% |
| Pueblo | 96.2 /100 | #118 | Exceptional 8.6% |
| Immigrants | Grenada | 96.2 /100 | #119 | Exceptional 8.6% |
| Israelis | 95.9 /100 | #120 | Exceptional 8.7% |
| Immigrants | Denmark | 95.5 /100 | #121 | Exceptional 8.7% |
| Immigrants | Egypt | 95.0 /100 | #122 | Exceptional 8.7% |
| Immigrants | Morocco | 94.9 /100 | #123 | Exceptional 8.7% |
| Immigrants | Lebanon | 94.9 /100 | #124 | Exceptional 8.7% |