Immigrants from Middle Africa vs Albanian Unemployment Among Women with Children Ages 6 to 17 years
COMPARE
Immigrants from Middle Africa
Albanian
Unemployment Among Women with Children Ages 6 to 17 years
Unemployment Among Women with Children Ages 6 to 17 years Comparison
Immigrants from Middle Africa
Albanians
9.1%
UNEMPLOYMENT AMONG WOMEN WITH CHILDREN AGES 6 TO 17 YEARS
15.6/ 100
METRIC RATING
202nd/ 347
METRIC RANK
8.6%
UNEMPLOYMENT AMONG WOMEN WITH CHILDREN AGES 6 TO 17 YEARS
96.3/ 100
METRIC RATING
117th/ 347
METRIC RANK
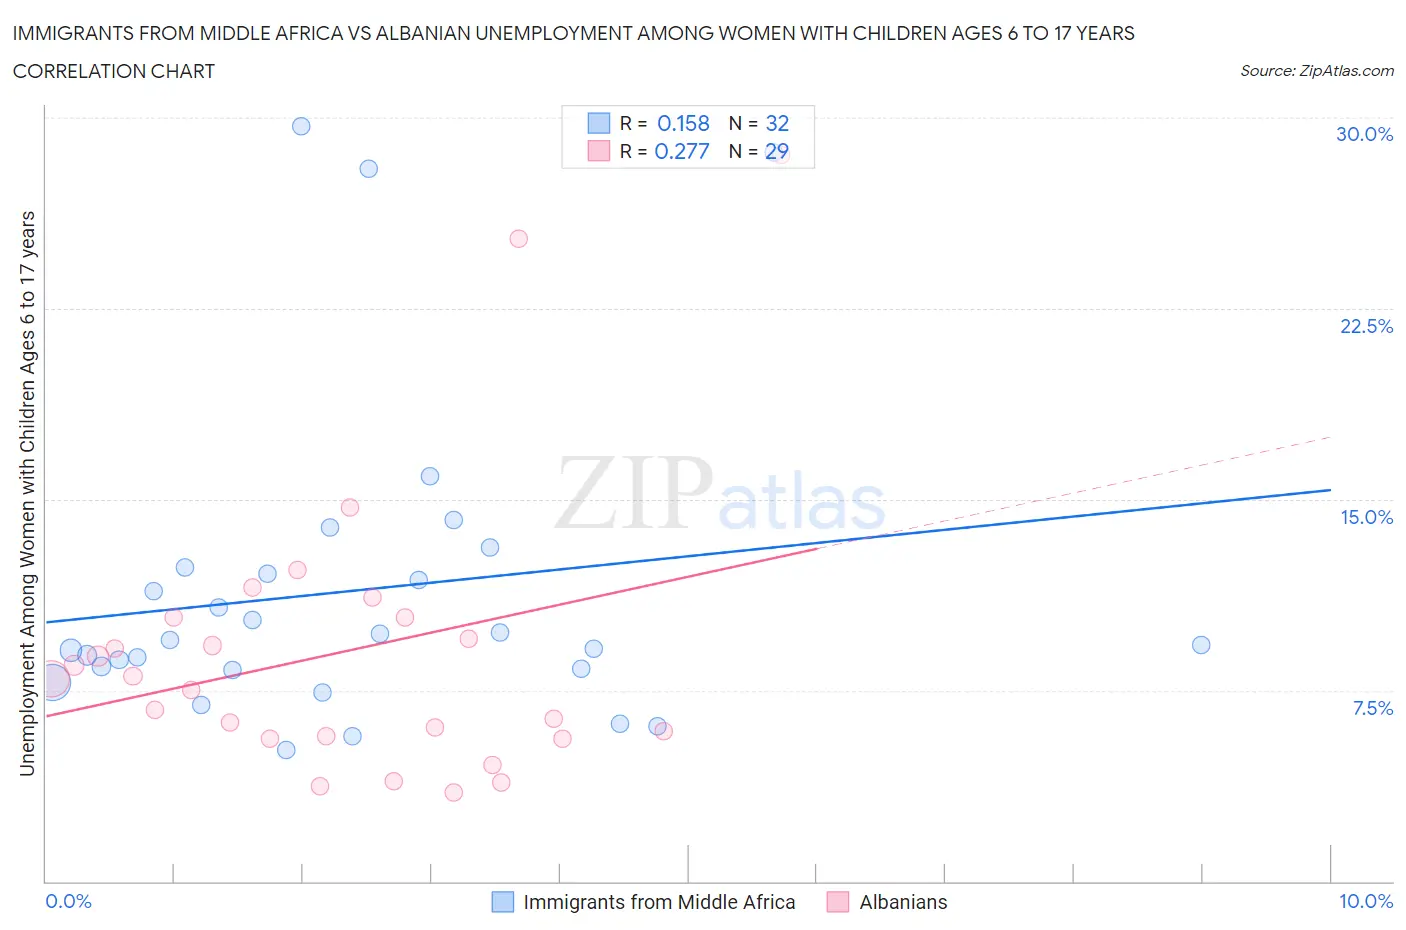
Immigrants from Middle Africa vs Albanian Unemployment Among Women with Children Ages 6 to 17 years Correlation Chart
The statistical analysis conducted on geographies consisting of 167,126,033 people shows a poor positive correlation between the proportion of Immigrants from Middle Africa and unemployment rate among women with children between the ages 6 and 17 in the United States with a correlation coefficient (R) of 0.158 and weighted average of 9.1%. Similarly, the statistical analysis conducted on geographies consisting of 149,986,101 people shows a weak positive correlation between the proportion of Albanians and unemployment rate among women with children between the ages 6 and 17 in the United States with a correlation coefficient (R) of 0.277 and weighted average of 8.6%, a difference of 5.7%.
Unemployment Among Women with Children Ages 6 to 17 years Correlation Summary
| Measurement | Immigrants from Middle Africa | Albanian |
| Minimum | 5.1% | 3.5% |
| Maximum | 29.6% | 28.5% |
| Range | 24.5% | 25.0% |
| Mean | 11.4% | 9.0% |
| Median | 9.4% | 8.0% |
| Interquartile 25% (IQ1) | 8.3% | 5.6% |
| Interquartile 75% (IQ3) | 12.2% | 10.4% |
| Interquartile Range (IQR) | 3.9% | 4.7% |
| Standard Deviation (Sample) | 6.2% | 5.7% |
| Standard Deviation (Population) | 6.1% | 5.6% |
Similar Demographics by Unemployment Among Women with Children Ages 6 to 17 years
Demographics Similar to Immigrants from Middle Africa by Unemployment Among Women with Children Ages 6 to 17 years
In terms of unemployment among women with children ages 6 to 17 years, the demographic groups most similar to Immigrants from Middle Africa are Maltese (9.1%, a difference of 0.020%), Immigrants from Canada (9.1%, a difference of 0.020%), Immigrants from Trinidad and Tobago (9.1%, a difference of 0.090%), Immigrants from Western Europe (9.1%, a difference of 0.13%), and Trinidadian and Tobagonian (9.1%, a difference of 0.20%).
| Demographics | Rating | Rank | Unemployment Among Women with Children Ages 6 to 17 years |
| Austrians | 25.0 /100 | #195 | Fair 9.1% |
| Brazilians | 24.4 /100 | #196 | Fair 9.1% |
| Immigrants | Panama | 24.3 /100 | #197 | Fair 9.1% |
| Guyanese | 21.8 /100 | #198 | Fair 9.1% |
| Czechoslovakians | 20.8 /100 | #199 | Fair 9.1% |
| Trinidadians and Tobagonians | 18.2 /100 | #200 | Poor 9.1% |
| Immigrants | Trinidad and Tobago | 16.7 /100 | #201 | Poor 9.1% |
| Immigrants | Middle Africa | 15.6 /100 | #202 | Poor 9.1% |
| Maltese | 15.3 /100 | #203 | Poor 9.1% |
| Immigrants | Canada | 15.3 /100 | #204 | Poor 9.1% |
| Immigrants | Western Europe | 14.1 /100 | #205 | Poor 9.1% |
| Immigrants | North America | 12.7 /100 | #206 | Poor 9.2% |
| Cubans | 10.9 /100 | #207 | Poor 9.2% |
| Immigrants | Peru | 10.8 /100 | #208 | Poor 9.2% |
| Salvadorans | 10.7 /100 | #209 | Poor 9.2% |
Demographics Similar to Albanians by Unemployment Among Women with Children Ages 6 to 17 years
In terms of unemployment among women with children ages 6 to 17 years, the demographic groups most similar to Albanians are Zimbabwean (8.6%, a difference of 0.010%), Pueblo (8.6%, a difference of 0.030%), Immigrants from Grenada (8.6%, a difference of 0.040%), Argentinean (8.6%, a difference of 0.080%), and Israeli (8.7%, a difference of 0.12%).
| Demographics | Rating | Rank | Unemployment Among Women with Children Ages 6 to 17 years |
| Latvians | 97.4 /100 | #110 | Exceptional 8.6% |
| Immigrants | Ukraine | 97.4 /100 | #111 | Exceptional 8.6% |
| Romanians | 97.1 /100 | #112 | Exceptional 8.6% |
| Eastern Europeans | 96.8 /100 | #113 | Exceptional 8.6% |
| Immigrants | Russia | 96.7 /100 | #114 | Exceptional 8.6% |
| Argentineans | 96.5 /100 | #115 | Exceptional 8.6% |
| Zimbabweans | 96.3 /100 | #116 | Exceptional 8.6% |
| Albanians | 96.3 /100 | #117 | Exceptional 8.6% |
| Pueblo | 96.2 /100 | #118 | Exceptional 8.6% |
| Immigrants | Grenada | 96.2 /100 | #119 | Exceptional 8.6% |
| Israelis | 95.9 /100 | #120 | Exceptional 8.7% |
| Immigrants | Denmark | 95.5 /100 | #121 | Exceptional 8.7% |
| Immigrants | Egypt | 95.0 /100 | #122 | Exceptional 8.7% |
| Immigrants | Morocco | 94.9 /100 | #123 | Exceptional 8.7% |
| Immigrants | Lebanon | 94.9 /100 | #124 | Exceptional 8.7% |