Ghanaian vs Portuguese Unemployment Among Women with Children Ages 6 to 17 years
COMPARE
Ghanaian
Portuguese
Unemployment Among Women with Children Ages 6 to 17 years
Unemployment Among Women with Children Ages 6 to 17 years Comparison
Ghanaians
Portuguese
9.6%
UNEMPLOYMENT AMONG WOMEN WITH CHILDREN AGES 6 TO 17 YEARS
0.2/ 100
METRIC RATING
268th/ 347
METRIC RANK
9.4%
UNEMPLOYMENT AMONG WOMEN WITH CHILDREN AGES 6 TO 17 YEARS
1.1/ 100
METRIC RATING
253rd/ 347
METRIC RANK
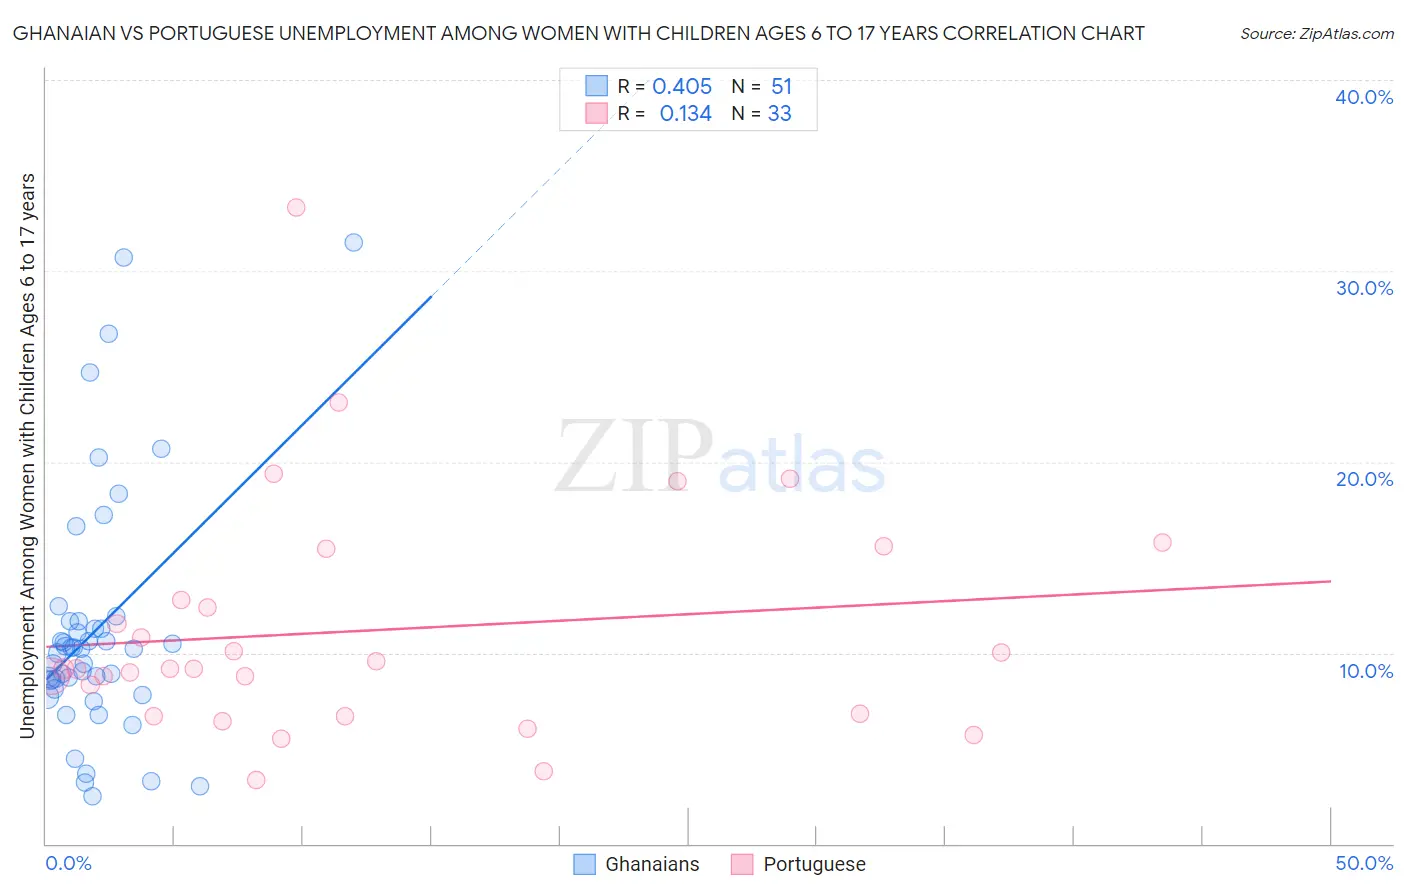
Ghanaian vs Portuguese Unemployment Among Women with Children Ages 6 to 17 years Correlation Chart
The statistical analysis conducted on geographies consisting of 158,398,422 people shows a moderate positive correlation between the proportion of Ghanaians and unemployment rate among women with children between the ages 6 and 17 in the United States with a correlation coefficient (R) of 0.405 and weighted average of 9.6%. Similarly, the statistical analysis conducted on geographies consisting of 310,563,323 people shows a poor positive correlation between the proportion of Portuguese and unemployment rate among women with children between the ages 6 and 17 in the United States with a correlation coefficient (R) of 0.134 and weighted average of 9.4%, a difference of 1.8%.
Unemployment Among Women with Children Ages 6 to 17 years Correlation Summary
| Measurement | Ghanaian | Portuguese |
| Minimum | 2.5% | 3.3% |
| Maximum | 31.5% | 33.4% |
| Range | 29.0% | 30.0% |
| Mean | 11.2% | 11.2% |
| Median | 10.2% | 9.2% |
| Interquartile 25% (IQ1) | 8.1% | 6.8% |
| Interquartile 75% (IQ3) | 11.6% | 14.1% |
| Interquartile Range (IQR) | 3.5% | 7.4% |
| Standard Deviation (Sample) | 6.4% | 6.2% |
| Standard Deviation (Population) | 6.3% | 6.1% |
Demographics Similar to Ghanaians and Portuguese by Unemployment Among Women with Children Ages 6 to 17 years
In terms of unemployment among women with children ages 6 to 17 years, the demographic groups most similar to Ghanaians are Blackfeet (9.6%, a difference of 0.080%), Immigrants from Nicaragua (9.6%, a difference of 0.18%), Irish (9.5%, a difference of 0.39%), Immigrants from Jamaica (9.5%, a difference of 0.41%), and West Indian (9.5%, a difference of 0.57%). Similarly, the demographic groups most similar to Portuguese are Creek (9.4%, a difference of 0.090%), Nicaraguan (9.4%, a difference of 0.17%), Central American (9.4%, a difference of 0.18%), Immigrants from Guatemala (9.4%, a difference of 0.20%), and Lithuanian (9.4%, a difference of 0.23%).
| Demographics | Rating | Rank | Unemployment Among Women with Children Ages 6 to 17 years |
| Immigrants | Guatemala | 1.3 /100 | #250 | Tragic 9.4% |
| Central Americans | 1.3 /100 | #251 | Tragic 9.4% |
| Creek | 1.2 /100 | #252 | Tragic 9.4% |
| Portuguese | 1.1 /100 | #253 | Tragic 9.4% |
| Nicaraguans | 1.0 /100 | #254 | Tragic 9.4% |
| Lithuanians | 0.9 /100 | #255 | Tragic 9.4% |
| Canadians | 0.8 /100 | #256 | Tragic 9.4% |
| Celtics | 0.7 /100 | #257 | Tragic 9.5% |
| Immigrants | Mexico | 0.7 /100 | #258 | Tragic 9.5% |
| Immigrants | Central America | 0.6 /100 | #259 | Tragic 9.5% |
| Italians | 0.6 /100 | #260 | Tragic 9.5% |
| South Americans | 0.5 /100 | #261 | Tragic 9.5% |
| Senegalese | 0.5 /100 | #262 | Tragic 9.5% |
| Lebanese | 0.5 /100 | #263 | Tragic 9.5% |
| Immigrants | Ghana | 0.4 /100 | #264 | Tragic 9.5% |
| West Indians | 0.4 /100 | #265 | Tragic 9.5% |
| Immigrants | Jamaica | 0.3 /100 | #266 | Tragic 9.5% |
| Irish | 0.3 /100 | #267 | Tragic 9.5% |
| Ghanaians | 0.2 /100 | #268 | Tragic 9.6% |
| Blackfeet | 0.2 /100 | #269 | Tragic 9.6% |
| Immigrants | Nicaragua | 0.2 /100 | #270 | Tragic 9.6% |