Czechoslovakian vs Spanish American Indian Unemployment Among Ages 60 to 64 years
COMPARE
Czechoslovakian
Spanish American Indian
Unemployment Among Ages 60 to 64 years
Unemployment Among Ages 60 to 64 years Comparison
Czechoslovakians
Spanish American Indians
4.6%
UNEMPLOYMENT AMONG AGES 60 TO 64 YEARS
99.7/ 100
METRIC RATING
63rd/ 347
METRIC RANK
5.4%
UNEMPLOYMENT AMONG AGES 60 TO 64 YEARS
0.0/ 100
METRIC RATING
308th/ 347
METRIC RANK
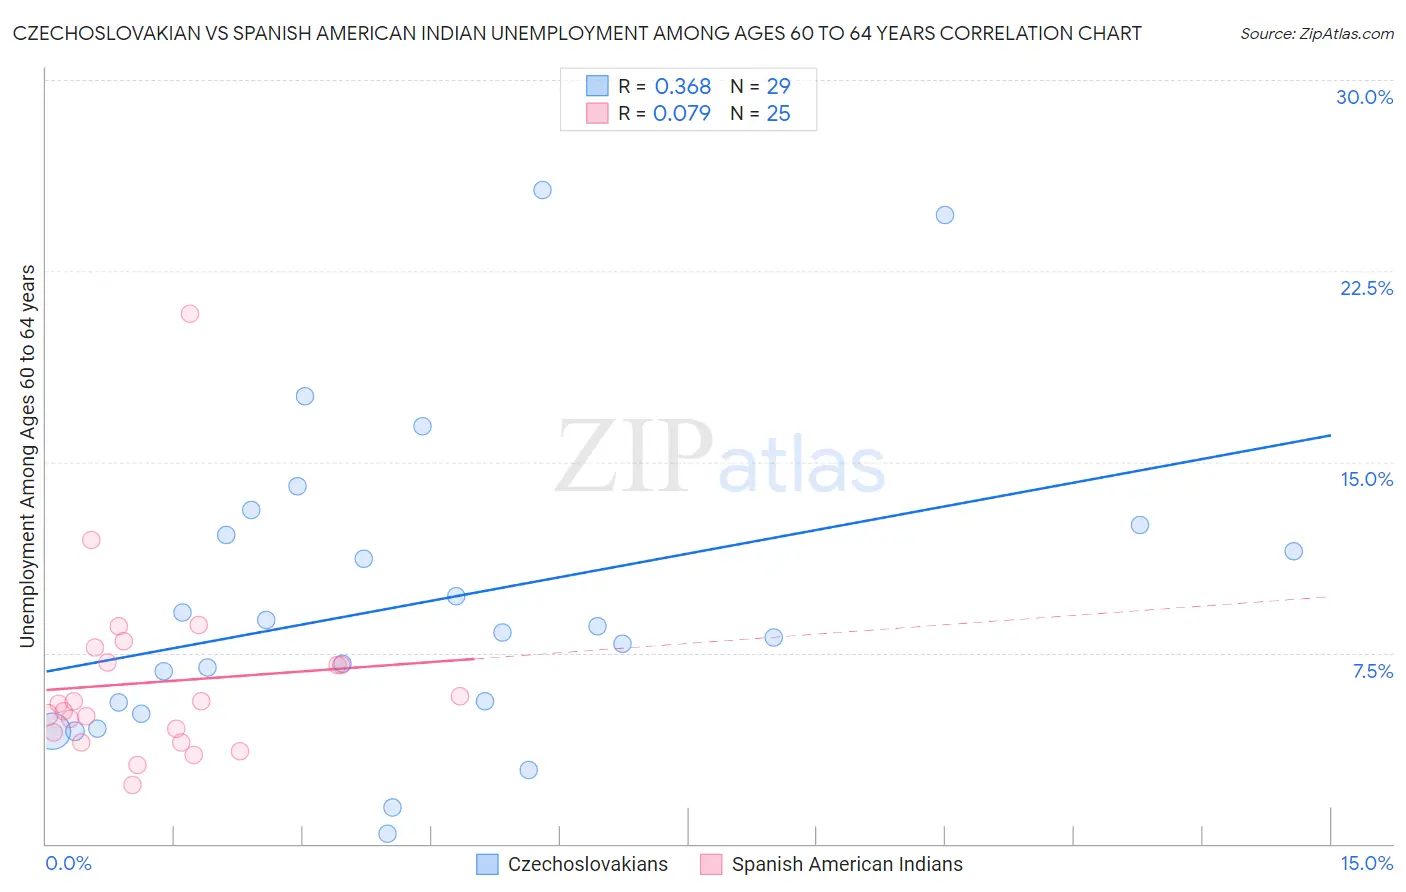
Czechoslovakian vs Spanish American Indian Unemployment Among Ages 60 to 64 years Correlation Chart
The statistical analysis conducted on geographies consisting of 329,606,514 people shows a mild positive correlation between the proportion of Czechoslovakians and unemployment rate among population between the ages 60 and 64 in the United States with a correlation coefficient (R) of 0.368 and weighted average of 4.6%. Similarly, the statistical analysis conducted on geographies consisting of 71,908,857 people shows a slight positive correlation between the proportion of Spanish American Indians and unemployment rate among population between the ages 60 and 64 in the United States with a correlation coefficient (R) of 0.079 and weighted average of 5.4%, a difference of 17.4%.
Unemployment Among Ages 60 to 64 years Correlation Summary
| Measurement | Czechoslovakian | Spanish American Indian |
| Minimum | 0.40% | 2.3% |
| Maximum | 25.7% | 20.8% |
| Range | 25.3% | 18.5% |
| Mean | 9.5% | 6.3% |
| Median | 8.3% | 5.5% |
| Interquartile 25% (IQ1) | 5.3% | 4.2% |
| Interquartile 75% (IQ3) | 12.3% | 7.4% |
| Interquartile Range (IQR) | 7.0% | 3.2% |
| Standard Deviation (Sample) | 6.0% | 3.7% |
| Standard Deviation (Population) | 5.9% | 3.6% |
Similar Demographics by Unemployment Among Ages 60 to 64 years
Demographics Similar to Czechoslovakians by Unemployment Among Ages 60 to 64 years
In terms of unemployment among ages 60 to 64 years, the demographic groups most similar to Czechoslovakians are Immigrants from Middle Africa (4.6%, a difference of 0.020%), Senegalese (4.6%, a difference of 0.030%), Jordanian (4.6%, a difference of 0.040%), Lebanese (4.6%, a difference of 0.13%), and Hawaiian (4.6%, a difference of 0.24%).
| Demographics | Rating | Rank | Unemployment Among Ages 60 to 64 years |
| Welsh | 99.9 /100 | #56 | Exceptional 4.6% |
| British | 99.9 /100 | #57 | Exceptional 4.6% |
| Immigrants | India | 99.8 /100 | #58 | Exceptional 4.6% |
| Swiss | 99.8 /100 | #59 | Exceptional 4.6% |
| Puget Sound Salish | 99.8 /100 | #60 | Exceptional 4.6% |
| Lebanese | 99.8 /100 | #61 | Exceptional 4.6% |
| Senegalese | 99.7 /100 | #62 | Exceptional 4.6% |
| Czechoslovakians | 99.7 /100 | #63 | Exceptional 4.6% |
| Immigrants | Middle Africa | 99.7 /100 | #64 | Exceptional 4.6% |
| Jordanians | 99.7 /100 | #65 | Exceptional 4.6% |
| Hawaiians | 99.6 /100 | #66 | Exceptional 4.6% |
| Immigrants | Scotland | 99.6 /100 | #67 | Exceptional 4.6% |
| Immigrants | Laos | 99.6 /100 | #68 | Exceptional 4.6% |
| Creek | 99.6 /100 | #69 | Exceptional 4.6% |
| Croatians | 99.5 /100 | #70 | Exceptional 4.6% |
Demographics Similar to Spanish American Indians by Unemployment Among Ages 60 to 64 years
In terms of unemployment among ages 60 to 64 years, the demographic groups most similar to Spanish American Indians are Soviet Union (5.4%, a difference of 0.010%), Immigrants from Guyana (5.4%, a difference of 0.020%), Immigrants from Dominica (5.4%, a difference of 0.18%), Cypriot (5.4%, a difference of 0.25%), and Immigrants from Mexico (5.4%, a difference of 0.27%).
| Demographics | Rating | Rank | Unemployment Among Ages 60 to 64 years |
| Immigrants | Jamaica | 0.0 /100 | #301 | Tragic 5.4% |
| Barbadians | 0.0 /100 | #302 | Tragic 5.4% |
| Bahamians | 0.0 /100 | #303 | Tragic 5.4% |
| Immigrants | Mexico | 0.0 /100 | #304 | Tragic 5.4% |
| Cypriots | 0.0 /100 | #305 | Tragic 5.4% |
| Immigrants | Dominica | 0.0 /100 | #306 | Tragic 5.4% |
| Immigrants | Guyana | 0.0 /100 | #307 | Tragic 5.4% |
| Spanish American Indians | 0.0 /100 | #308 | Tragic 5.4% |
| Soviet Union | 0.0 /100 | #309 | Tragic 5.4% |
| British West Indians | 0.0 /100 | #310 | Tragic 5.5% |
| U.S. Virgin Islanders | 0.0 /100 | #311 | Tragic 5.5% |
| Immigrants | West Indies | 0.0 /100 | #312 | Tragic 5.5% |
| Belizeans | 0.0 /100 | #313 | Tragic 5.5% |
| Guyanese | 0.0 /100 | #314 | Tragic 5.5% |
| Cree | 0.0 /100 | #315 | Tragic 5.6% |