German vs Mexican American Indian Unemployment Among Seniors over 75 years
COMPARE
German
Mexican American Indian
Unemployment Among Seniors over 75 years
Unemployment Among Seniors over 75 years Comparison
Germans
Mexican American Indians
10.3%
UNEMPLOYMENT AMONG SENIORS OVER 75 YEARS
0.0/ 100
METRIC RATING
319th/ 347
METRIC RANK
8.8%
UNEMPLOYMENT AMONG SENIORS OVER 75 YEARS
34.7/ 100
METRIC RATING
190th/ 347
METRIC RANK
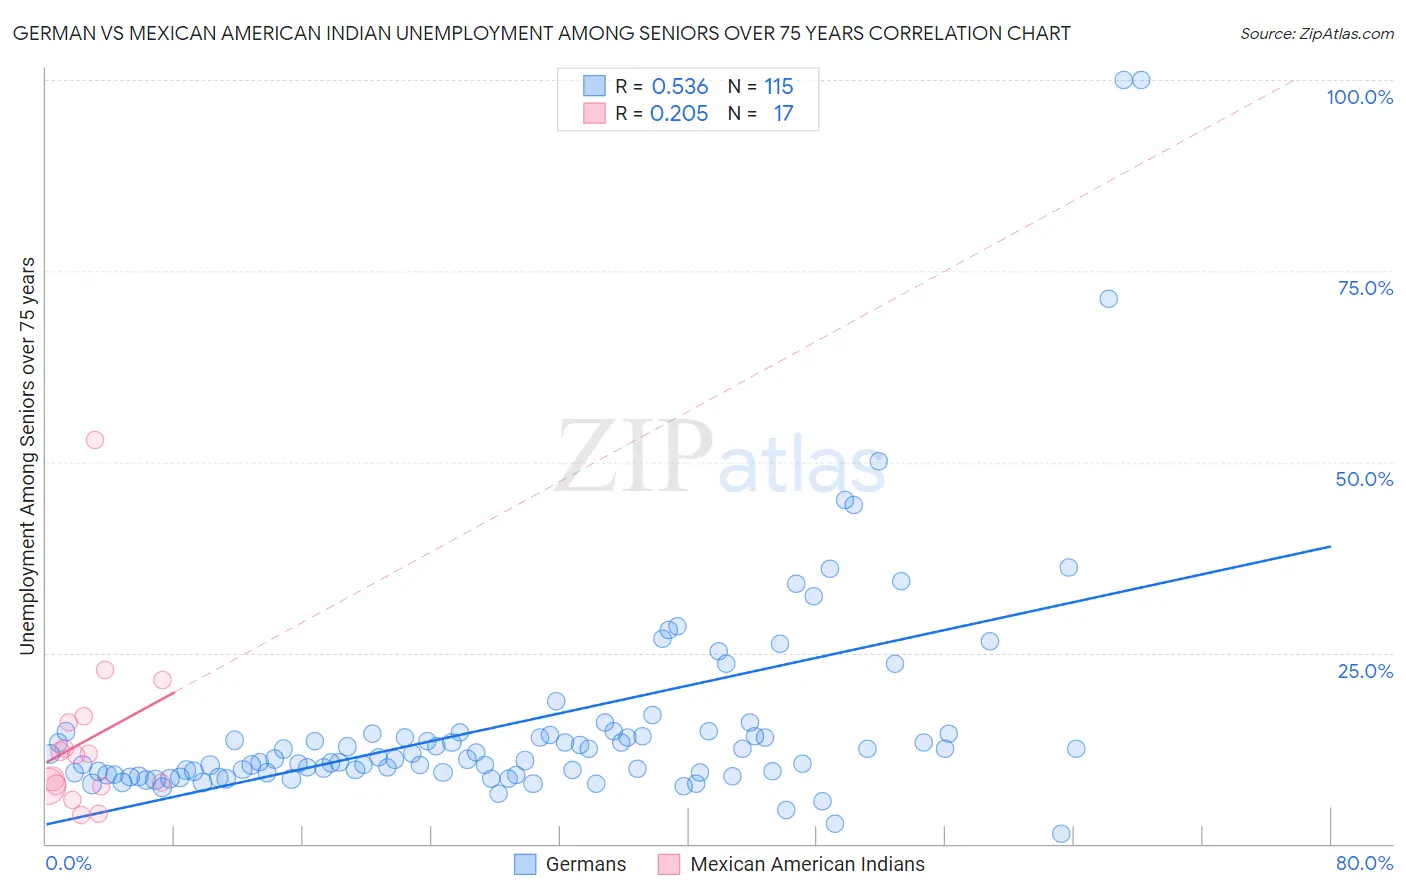
German vs Mexican American Indian Unemployment Among Seniors over 75 years Correlation Chart
The statistical analysis conducted on geographies consisting of 235,541,085 people shows a substantial positive correlation between the proportion of Germans and unemployment rate among seniors over the age of 75 in the United States with a correlation coefficient (R) of 0.536 and weighted average of 10.3%. Similarly, the statistical analysis conducted on geographies consisting of 172,243,221 people shows a weak positive correlation between the proportion of Mexican American Indians and unemployment rate among seniors over the age of 75 in the United States with a correlation coefficient (R) of 0.205 and weighted average of 8.8%, a difference of 16.3%.
Unemployment Among Seniors over 75 years Correlation Summary
| Measurement | German | Mexican American Indian |
| Minimum | 1.3% | 3.8% |
| Maximum | 100.0% | 52.9% |
| Range | 98.7% | 49.1% |
| Mean | 15.9% | 13.6% |
| Median | 11.1% | 11.7% |
| Interquartile 25% (IQ1) | 9.3% | 7.5% |
| Interquartile 75% (IQ3) | 14.4% | 16.3% |
| Interquartile Range (IQR) | 5.0% | 8.8% |
| Standard Deviation (Sample) | 15.1% | 11.5% |
| Standard Deviation (Population) | 15.0% | 11.2% |
Similar Demographics by Unemployment Among Seniors over 75 years
Demographics Similar to Germans by Unemployment Among Seniors over 75 years
In terms of unemployment among seniors over 75 years, the demographic groups most similar to Germans are Liberian (10.2%, a difference of 0.070%), Irish (10.2%, a difference of 0.20%), French (10.3%, a difference of 0.22%), Aleut (10.3%, a difference of 0.23%), and Native/Alaskan (10.2%, a difference of 0.56%).
| Demographics | Rating | Rank | Unemployment Among Seniors over 75 years |
| Chippewa | 0.0 /100 | #312 | Tragic 10.1% |
| Nepalese | 0.0 /100 | #313 | Tragic 10.1% |
| Dutch West Indians | 0.0 /100 | #314 | Tragic 10.2% |
| Pennsylvania Germans | 0.0 /100 | #315 | Tragic 10.2% |
| Natives/Alaskans | 0.0 /100 | #316 | Tragic 10.2% |
| Irish | 0.0 /100 | #317 | Tragic 10.2% |
| Liberians | 0.0 /100 | #318 | Tragic 10.2% |
| Germans | 0.0 /100 | #319 | Tragic 10.3% |
| French | 0.0 /100 | #320 | Tragic 10.3% |
| Aleuts | 0.0 /100 | #321 | Tragic 10.3% |
| Poles | 0.0 /100 | #322 | Tragic 10.3% |
| Tongans | 0.0 /100 | #323 | Tragic 10.4% |
| Americans | 0.0 /100 | #324 | Tragic 10.4% |
| Portuguese | 0.0 /100 | #325 | Tragic 10.4% |
| Slovaks | 0.0 /100 | #326 | Tragic 10.4% |
Demographics Similar to Mexican American Indians by Unemployment Among Seniors over 75 years
In terms of unemployment among seniors over 75 years, the demographic groups most similar to Mexican American Indians are Immigrants from Eastern Europe (8.8%, a difference of 0.0%), Immigrants from Haiti (8.8%, a difference of 0.0%), Immigrants from Europe (8.8%, a difference of 0.030%), Estonian (8.8%, a difference of 0.080%), and Immigrants from Ethiopia (8.8%, a difference of 0.090%).
| Demographics | Rating | Rank | Unemployment Among Seniors over 75 years |
| Immigrants | Afghanistan | 38.2 /100 | #183 | Fair 8.8% |
| Immigrants | Micronesia | 37.2 /100 | #184 | Fair 8.8% |
| Choctaw | 37.1 /100 | #185 | Fair 8.8% |
| Immigrants | Ethiopia | 36.2 /100 | #186 | Fair 8.8% |
| Immigrants | Europe | 35.2 /100 | #187 | Fair 8.8% |
| Immigrants | Eastern Europe | 34.7 /100 | #188 | Fair 8.8% |
| Immigrants | Haiti | 34.7 /100 | #189 | Fair 8.8% |
| Mexican American Indians | 34.7 /100 | #190 | Fair 8.8% |
| Estonians | 33.3 /100 | #191 | Fair 8.8% |
| Immigrants | Kenya | 31.8 /100 | #192 | Fair 8.8% |
| Immigrants | Guyana | 29.9 /100 | #193 | Fair 8.8% |
| Maltese | 29.2 /100 | #194 | Fair 8.8% |
| Okinawans | 28.9 /100 | #195 | Fair 8.8% |
| Immigrants | Jamaica | 27.7 /100 | #196 | Fair 8.9% |
| Immigrants | Laos | 26.3 /100 | #197 | Fair 8.9% |