German vs Cajun Unemployment Among Seniors over 75 years
COMPARE
German
Cajun
Unemployment Among Seniors over 75 years
Unemployment Among Seniors over 75 years Comparison
Germans
Cajuns
10.3%
UNEMPLOYMENT AMONG SENIORS OVER 75 YEARS
0.0/ 100
METRIC RATING
319th/ 347
METRIC RANK
12.5%
UNEMPLOYMENT AMONG SENIORS OVER 75 YEARS
0.0/ 100
METRIC RATING
339th/ 347
METRIC RANK
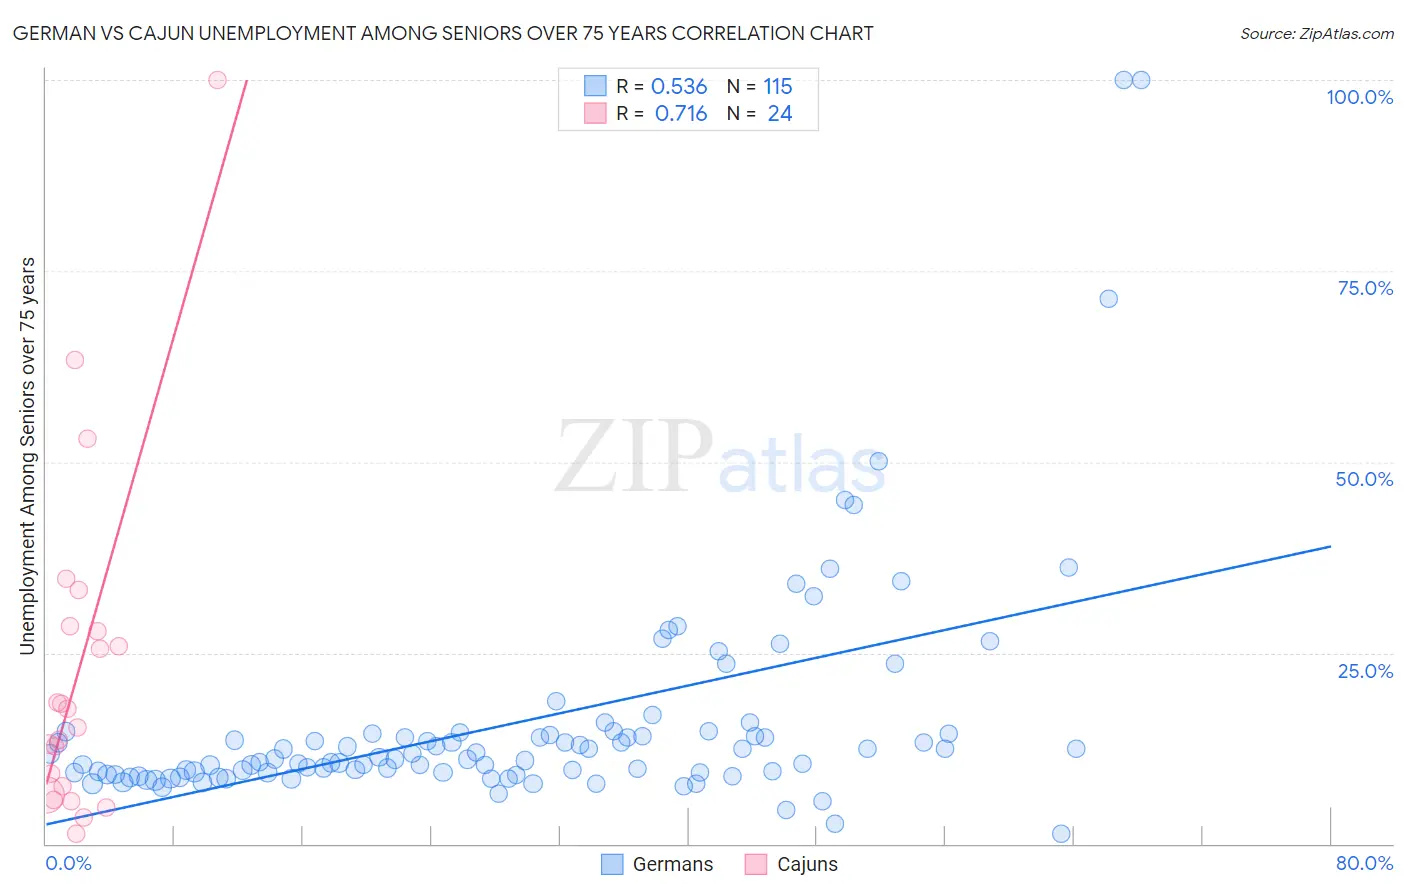
German vs Cajun Unemployment Among Seniors over 75 years Correlation Chart
The statistical analysis conducted on geographies consisting of 235,541,085 people shows a substantial positive correlation between the proportion of Germans and unemployment rate among seniors over the age of 75 in the United States with a correlation coefficient (R) of 0.536 and weighted average of 10.3%. Similarly, the statistical analysis conducted on geographies consisting of 99,585,349 people shows a strong positive correlation between the proportion of Cajuns and unemployment rate among seniors over the age of 75 in the United States with a correlation coefficient (R) of 0.716 and weighted average of 12.5%, a difference of 21.8%.
Unemployment Among Seniors over 75 years Correlation Summary
| Measurement | German | Cajun |
| Minimum | 1.3% | 1.3% |
| Maximum | 100.0% | 100.0% |
| Range | 98.7% | 98.7% |
| Mean | 15.9% | 22.7% |
| Median | 11.1% | 16.4% |
| Interquartile 25% (IQ1) | 9.3% | 6.9% |
| Interquartile 75% (IQ3) | 14.4% | 28.1% |
| Interquartile Range (IQR) | 5.0% | 21.2% |
| Standard Deviation (Sample) | 15.1% | 22.5% |
| Standard Deviation (Population) | 15.0% | 22.1% |
Demographics Similar to Germans and Cajuns by Unemployment Among Seniors over 75 years
In terms of unemployment among seniors over 75 years, the demographic groups most similar to Germans are French (10.3%, a difference of 0.22%), Aleut (10.3%, a difference of 0.23%), Polish (10.3%, a difference of 0.59%), Tongan (10.4%, a difference of 1.2%), and American (10.4%, a difference of 1.3%). Similarly, the demographic groups most similar to Cajuns are Immigrants from Cabo Verde (12.3%, a difference of 1.3%), Cape Verdean (11.4%, a difference of 9.4%), Immigrants from North Macedonia (11.3%, a difference of 10.4%), French Canadian (11.2%, a difference of 11.7%), and Assyrian/Chaldean/Syriac (11.1%, a difference of 12.9%).
| Demographics | Rating | Rank | Unemployment Among Seniors over 75 years |
| Germans | 0.0 /100 | #319 | Tragic 10.3% |
| French | 0.0 /100 | #320 | Tragic 10.3% |
| Aleuts | 0.0 /100 | #321 | Tragic 10.3% |
| Poles | 0.0 /100 | #322 | Tragic 10.3% |
| Tongans | 0.0 /100 | #323 | Tragic 10.4% |
| Americans | 0.0 /100 | #324 | Tragic 10.4% |
| Portuguese | 0.0 /100 | #325 | Tragic 10.4% |
| Slovaks | 0.0 /100 | #326 | Tragic 10.4% |
| Dutch | 0.0 /100 | #327 | Tragic 10.4% |
| Immigrants | Portugal | 0.0 /100 | #328 | Tragic 10.5% |
| Tsimshian | 0.0 /100 | #329 | Tragic 10.5% |
| Immigrants | Azores | 0.0 /100 | #330 | Tragic 10.7% |
| Tohono O'odham | 0.0 /100 | #331 | Tragic 10.8% |
| Immigrants | Liberia | 0.0 /100 | #332 | Tragic 10.9% |
| Alaskan Athabascans | 0.0 /100 | #333 | Tragic 11.0% |
| Assyrians/Chaldeans/Syriacs | 0.0 /100 | #334 | Tragic 11.1% |
| French Canadians | 0.0 /100 | #335 | Tragic 11.2% |
| Immigrants | North Macedonia | 0.0 /100 | #336 | Tragic 11.3% |
| Cape Verdeans | 0.0 /100 | #337 | Tragic 11.4% |
| Immigrants | Cabo Verde | 0.0 /100 | #338 | Tragic 12.3% |
| Cajuns | 0.0 /100 | #339 | Tragic 12.5% |