Vietnamese vs Mexican American Indian Unemployment Among Seniors over 75 years
COMPARE
Vietnamese
Mexican American Indian
Unemployment Among Seniors over 75 years
Unemployment Among Seniors over 75 years Comparison
Vietnamese
Mexican American Indians
9.1%
UNEMPLOYMENT AMONG SENIORS OVER 75 YEARS
4.6/ 100
METRIC RATING
234th/ 347
METRIC RANK
8.8%
UNEMPLOYMENT AMONG SENIORS OVER 75 YEARS
34.7/ 100
METRIC RATING
190th/ 347
METRIC RANK
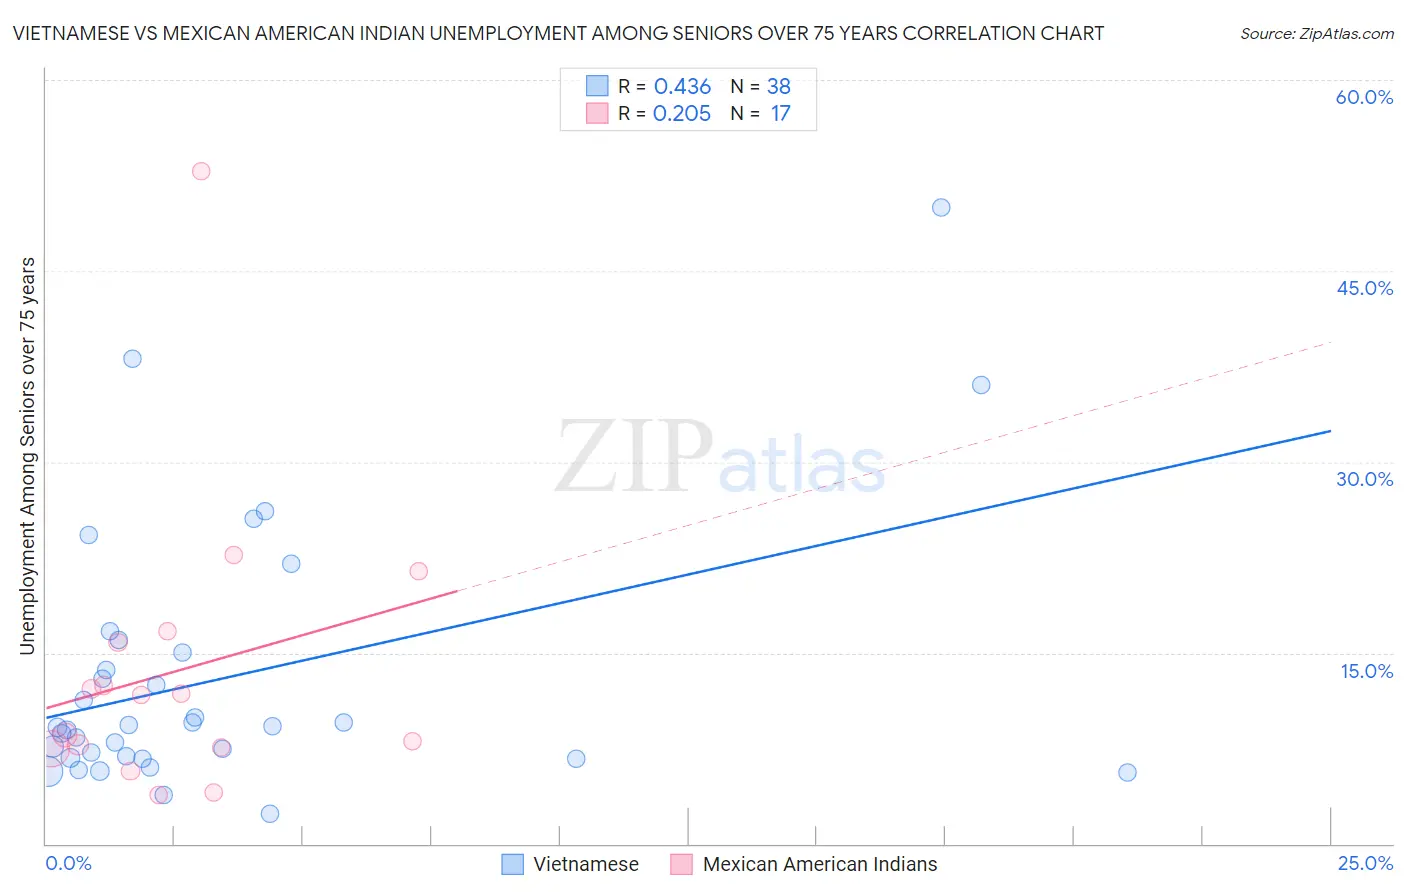
Vietnamese vs Mexican American Indian Unemployment Among Seniors over 75 years Correlation Chart
The statistical analysis conducted on geographies consisting of 116,269,326 people shows a moderate positive correlation between the proportion of Vietnamese and unemployment rate among seniors over the age of 75 in the United States with a correlation coefficient (R) of 0.436 and weighted average of 9.1%. Similarly, the statistical analysis conducted on geographies consisting of 172,243,221 people shows a weak positive correlation between the proportion of Mexican American Indians and unemployment rate among seniors over the age of 75 in the United States with a correlation coefficient (R) of 0.205 and weighted average of 8.8%, a difference of 3.2%.
Unemployment Among Seniors over 75 years Correlation Summary
| Measurement | Vietnamese | Mexican American Indian |
| Minimum | 2.4% | 3.8% |
| Maximum | 50.0% | 52.9% |
| Range | 47.6% | 49.1% |
| Mean | 13.0% | 13.6% |
| Median | 9.2% | 11.7% |
| Interquartile 25% (IQ1) | 6.7% | 7.5% |
| Interquartile 75% (IQ3) | 15.0% | 16.3% |
| Interquartile Range (IQR) | 8.3% | 8.8% |
| Standard Deviation (Sample) | 10.3% | 11.5% |
| Standard Deviation (Population) | 10.2% | 11.2% |
Similar Demographics by Unemployment Among Seniors over 75 years
Demographics Similar to Vietnamese by Unemployment Among Seniors over 75 years
In terms of unemployment among seniors over 75 years, the demographic groups most similar to Vietnamese are Yugoslavian (9.1%, a difference of 0.050%), African (9.1%, a difference of 0.070%), Northern European (9.1%, a difference of 0.090%), Immigrants from Central America (9.1%, a difference of 0.090%), and Hispanic or Latino (9.1%, a difference of 0.10%).
| Demographics | Rating | Rank | Unemployment Among Seniors over 75 years |
| Samoans | 5.7 /100 | #227 | Tragic 9.1% |
| Kenyans | 5.4 /100 | #228 | Tragic 9.1% |
| Hispanics or Latinos | 5.0 /100 | #229 | Tragic 9.1% |
| Northern Europeans | 4.9 /100 | #230 | Tragic 9.1% |
| Immigrants | Central America | 4.9 /100 | #231 | Tragic 9.1% |
| Africans | 4.9 /100 | #232 | Tragic 9.1% |
| Yugoslavians | 4.8 /100 | #233 | Tragic 9.1% |
| Vietnamese | 4.6 /100 | #234 | Tragic 9.1% |
| Panamanians | 4.0 /100 | #235 | Tragic 9.1% |
| Jordanians | 4.0 /100 | #236 | Tragic 9.1% |
| Houma | 3.9 /100 | #237 | Tragic 9.1% |
| Inupiat | 3.6 /100 | #238 | Tragic 9.1% |
| Mexicans | 3.5 /100 | #239 | Tragic 9.1% |
| Spanish | 3.3 /100 | #240 | Tragic 9.1% |
| Immigrants | Southern Europe | 2.8 /100 | #241 | Tragic 9.2% |
Demographics Similar to Mexican American Indians by Unemployment Among Seniors over 75 years
In terms of unemployment among seniors over 75 years, the demographic groups most similar to Mexican American Indians are Immigrants from Eastern Europe (8.8%, a difference of 0.0%), Immigrants from Haiti (8.8%, a difference of 0.0%), Immigrants from Europe (8.8%, a difference of 0.030%), Estonian (8.8%, a difference of 0.080%), and Immigrants from Ethiopia (8.8%, a difference of 0.090%).
| Demographics | Rating | Rank | Unemployment Among Seniors over 75 years |
| Immigrants | Afghanistan | 38.2 /100 | #183 | Fair 8.8% |
| Immigrants | Micronesia | 37.2 /100 | #184 | Fair 8.8% |
| Choctaw | 37.1 /100 | #185 | Fair 8.8% |
| Immigrants | Ethiopia | 36.2 /100 | #186 | Fair 8.8% |
| Immigrants | Europe | 35.2 /100 | #187 | Fair 8.8% |
| Immigrants | Eastern Europe | 34.7 /100 | #188 | Fair 8.8% |
| Immigrants | Haiti | 34.7 /100 | #189 | Fair 8.8% |
| Mexican American Indians | 34.7 /100 | #190 | Fair 8.8% |
| Estonians | 33.3 /100 | #191 | Fair 8.8% |
| Immigrants | Kenya | 31.8 /100 | #192 | Fair 8.8% |
| Immigrants | Guyana | 29.9 /100 | #193 | Fair 8.8% |
| Maltese | 29.2 /100 | #194 | Fair 8.8% |
| Okinawans | 28.9 /100 | #195 | Fair 8.8% |
| Immigrants | Jamaica | 27.7 /100 | #196 | Fair 8.9% |
| Immigrants | Laos | 26.3 /100 | #197 | Fair 8.9% |