Immigrants from Saudi Arabia vs Filipino Unemployment Among Ages 30 to 34 years
COMPARE
Immigrants from Saudi Arabia
Filipino
Unemployment Among Ages 30 to 34 years
Unemployment Among Ages 30 to 34 years Comparison
Immigrants from Saudi Arabia
Filipinos
5.0%
UNEMPLOYMENT AMONG AGES 30 TO 34 YEARS
99.3/ 100
METRIC RATING
33rd/ 347
METRIC RANK
4.8%
UNEMPLOYMENT AMONG AGES 30 TO 34 YEARS
99.9/ 100
METRIC RATING
12th/ 347
METRIC RANK
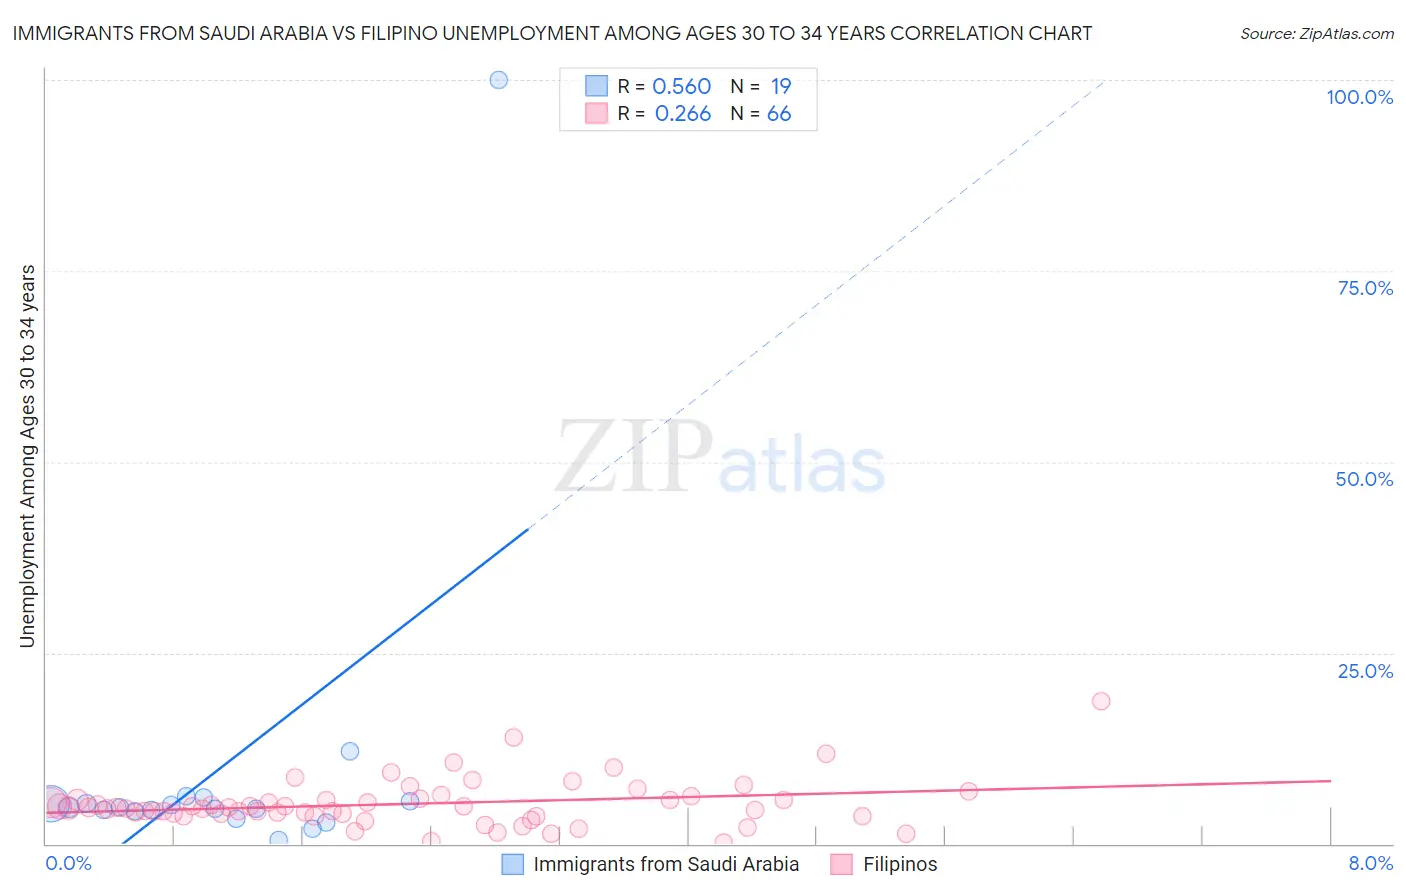
Immigrants from Saudi Arabia vs Filipino Unemployment Among Ages 30 to 34 years Correlation Chart
The statistical analysis conducted on geographies consisting of 161,358,115 people shows a substantial positive correlation between the proportion of Immigrants from Saudi Arabia and unemployment rate among population between the ages 30 and 34 in the United States with a correlation coefficient (R) of 0.560 and weighted average of 5.0%. Similarly, the statistical analysis conducted on geographies consisting of 245,104,087 people shows a weak positive correlation between the proportion of Filipinos and unemployment rate among population between the ages 30 and 34 in the United States with a correlation coefficient (R) of 0.266 and weighted average of 4.8%, a difference of 3.8%.
Unemployment Among Ages 30 to 34 years Correlation Summary
| Measurement | Immigrants from Saudi Arabia | Filipino |
| Minimum | 0.48% | 0.20% |
| Maximum | 100.0% | 18.6% |
| Range | 99.5% | 18.4% |
| Mean | 9.8% | 5.2% |
| Median | 4.8% | 4.7% |
| Interquartile 25% (IQ1) | 4.3% | 3.9% |
| Interquartile 75% (IQ3) | 5.5% | 5.8% |
| Interquartile Range (IQR) | 1.2% | 1.9% |
| Standard Deviation (Sample) | 22.0% | 3.0% |
| Standard Deviation (Population) | 21.4% | 3.0% |
Similar Demographics by Unemployment Among Ages 30 to 34 years
Demographics Similar to Immigrants from Saudi Arabia by Unemployment Among Ages 30 to 34 years
In terms of unemployment among ages 30 to 34 years, the demographic groups most similar to Immigrants from Saudi Arabia are Latvian (5.0%, a difference of 0.050%), Immigrants from Zaire (5.0%, a difference of 0.10%), Somali (5.0%, a difference of 0.14%), Norwegian (5.0%, a difference of 0.23%), and German Russian (5.0%, a difference of 0.25%).
| Demographics | Rating | Rank | Unemployment Among Ages 30 to 34 years |
| Immigrants | Kuwait | 99.5 /100 | #26 | Exceptional 5.0% |
| Danes | 99.5 /100 | #27 | Exceptional 5.0% |
| Immigrants | Cuba | 99.4 /100 | #28 | Exceptional 5.0% |
| German Russians | 99.4 /100 | #29 | Exceptional 5.0% |
| Norwegians | 99.4 /100 | #30 | Exceptional 5.0% |
| Somalis | 99.3 /100 | #31 | Exceptional 5.0% |
| Immigrants | Zaire | 99.3 /100 | #32 | Exceptional 5.0% |
| Immigrants | Saudi Arabia | 99.3 /100 | #33 | Exceptional 5.0% |
| Latvians | 99.3 /100 | #34 | Exceptional 5.0% |
| Immigrants | Ethiopia | 99.2 /100 | #35 | Exceptional 5.0% |
| Czechs | 99.2 /100 | #36 | Exceptional 5.0% |
| Immigrants | Turkey | 99.0 /100 | #37 | Exceptional 5.0% |
| Sri Lankans | 99.0 /100 | #38 | Exceptional 5.0% |
| Fijians | 99.0 /100 | #39 | Exceptional 5.0% |
| Immigrants | Vietnam | 98.9 /100 | #40 | Exceptional 5.0% |
Demographics Similar to Filipinos by Unemployment Among Ages 30 to 34 years
In terms of unemployment among ages 30 to 34 years, the demographic groups most similar to Filipinos are Cambodian (4.8%, a difference of 0.0%), Luxembourger (4.8%, a difference of 0.010%), Okinawan (4.8%, a difference of 0.39%), Zimbabwean (4.8%, a difference of 0.49%), and Immigrants from Bulgaria (4.8%, a difference of 0.60%).
| Demographics | Rating | Rank | Unemployment Among Ages 30 to 34 years |
| Venezuelans | 100.0 /100 | #5 | Exceptional 4.7% |
| Immigrants | Bosnia and Herzegovina | 100.0 /100 | #6 | Exceptional 4.7% |
| Thais | 100.0 /100 | #7 | Exceptional 4.7% |
| Immigrants | Eritrea | 100.0 /100 | #8 | Exceptional 4.7% |
| Bulgarians | 99.9 /100 | #9 | Exceptional 4.7% |
| Tongans | 99.9 /100 | #10 | Exceptional 4.8% |
| Immigrants | Bolivia | 99.9 /100 | #11 | Exceptional 4.8% |
| Filipinos | 99.9 /100 | #12 | Exceptional 4.8% |
| Cambodians | 99.9 /100 | #13 | Exceptional 4.8% |
| Luxembourgers | 99.9 /100 | #14 | Exceptional 4.8% |
| Okinawans | 99.9 /100 | #15 | Exceptional 4.8% |
| Zimbabweans | 99.9 /100 | #16 | Exceptional 4.8% |
| Immigrants | Bulgaria | 99.9 /100 | #17 | Exceptional 4.8% |
| Bolivians | 99.8 /100 | #18 | Exceptional 4.9% |
| Immigrants | Sudan | 99.8 /100 | #19 | Exceptional 4.9% |