German Russian vs Immigrants from El Salvador Unemployment Among Women with Children Under 18 years
COMPARE
German Russian
Immigrants from El Salvador
Unemployment Among Women with Children Under 18 years
Unemployment Among Women with Children Under 18 years Comparison
German Russians
Immigrants from El Salvador
5.4%
UNEMPLOYMENT AMONG WOMEN WITH CHILDREN UNDER 18 YEARS
70.2/ 100
METRIC RATING
157th/ 347
METRIC RANK
6.3%
UNEMPLOYMENT AMONG WOMEN WITH CHILDREN UNDER 18 YEARS
0.0/ 100
METRIC RATING
281st/ 347
METRIC RANK
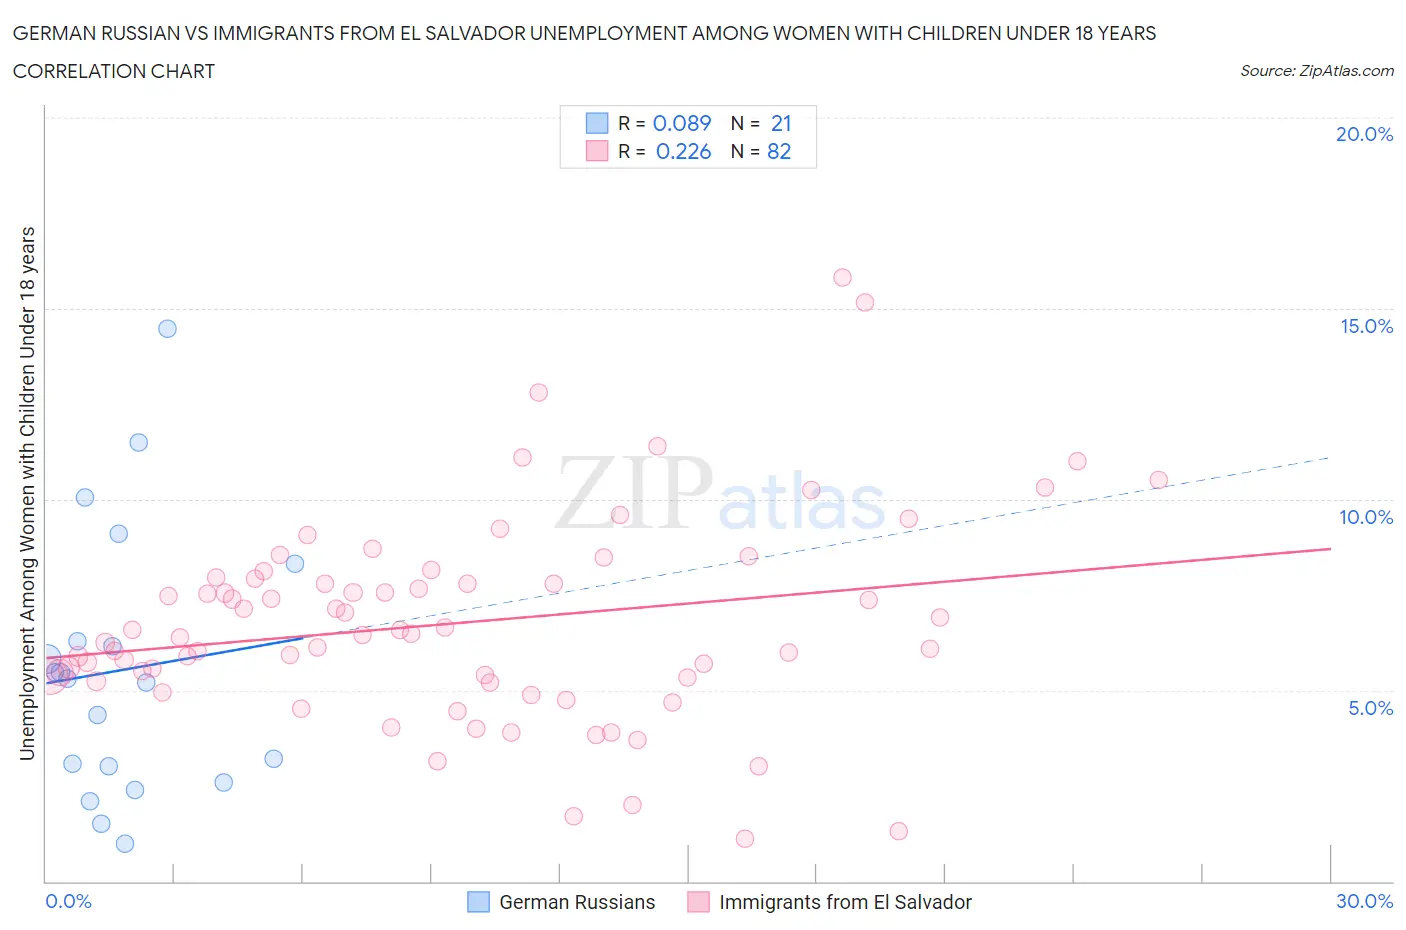
German Russian vs Immigrants from El Salvador Unemployment Among Women with Children Under 18 years Correlation Chart
The statistical analysis conducted on geographies consisting of 94,995,777 people shows a slight positive correlation between the proportion of German Russians and unemployment rate among women with children under the age of 18 in the United States with a correlation coefficient (R) of 0.089 and weighted average of 5.4%. Similarly, the statistical analysis conducted on geographies consisting of 348,177,746 people shows a weak positive correlation between the proportion of Immigrants from El Salvador and unemployment rate among women with children under the age of 18 in the United States with a correlation coefficient (R) of 0.226 and weighted average of 6.3%, a difference of 17.4%.
Unemployment Among Women with Children Under 18 years Correlation Summary
| Measurement | German Russian | Immigrants from El Salvador |
| Minimum | 0.98% | 1.1% |
| Maximum | 14.5% | 15.8% |
| Range | 13.5% | 14.7% |
| Mean | 5.5% | 6.8% |
| Median | 5.3% | 6.5% |
| Interquartile 25% (IQ1) | 2.8% | 5.3% |
| Interquartile 75% (IQ3) | 7.3% | 7.9% |
| Interquartile Range (IQR) | 4.5% | 2.6% |
| Standard Deviation (Sample) | 3.5% | 2.7% |
| Standard Deviation (Population) | 3.4% | 2.7% |
Similar Demographics by Unemployment Among Women with Children Under 18 years
Demographics Similar to German Russians by Unemployment Among Women with Children Under 18 years
In terms of unemployment among women with children under 18 years, the demographic groups most similar to German Russians are South African (5.4%, a difference of 0.010%), Korean (5.4%, a difference of 0.030%), Carpatho Rusyn (5.4%, a difference of 0.050%), Immigrants from Latvia (5.4%, a difference of 0.050%), and Immigrants from Burma/Myanmar (5.4%, a difference of 0.060%).
| Demographics | Rating | Rank | Unemployment Among Women with Children Under 18 years |
| Immigrants | Argentina | 71.7 /100 | #150 | Good 5.4% |
| Immigrants | Iran | 71.1 /100 | #151 | Good 5.4% |
| Immigrants | South Eastern Asia | 71.1 /100 | #152 | Good 5.4% |
| Carpatho Rusyns | 70.8 /100 | #153 | Good 5.4% |
| Immigrants | Latvia | 70.8 /100 | #154 | Good 5.4% |
| Koreans | 70.5 /100 | #155 | Good 5.4% |
| South Africans | 70.3 /100 | #156 | Good 5.4% |
| German Russians | 70.2 /100 | #157 | Good 5.4% |
| Immigrants | Burma/Myanmar | 69.5 /100 | #158 | Good 5.4% |
| Chickasaw | 68.4 /100 | #159 | Good 5.4% |
| Afghans | 66.6 /100 | #160 | Good 5.4% |
| Immigrants | Iraq | 65.9 /100 | #161 | Good 5.4% |
| Immigrants | Saudi Arabia | 65.0 /100 | #162 | Good 5.4% |
| Lebanese | 64.7 /100 | #163 | Good 5.4% |
| Celtics | 63.0 /100 | #164 | Good 5.4% |
Demographics Similar to Immigrants from El Salvador by Unemployment Among Women with Children Under 18 years
In terms of unemployment among women with children under 18 years, the demographic groups most similar to Immigrants from El Salvador are Immigrants from St. Vincent and the Grenadines (6.3%, a difference of 0.010%), Guatemalan (6.3%, a difference of 0.16%), West Indian (6.3%, a difference of 0.19%), Immigrants from Grenada (6.3%, a difference of 0.23%), and Bahamian (6.3%, a difference of 0.38%).
| Demographics | Rating | Rank | Unemployment Among Women with Children Under 18 years |
| Senegalese | 0.0 /100 | #274 | Tragic 6.2% |
| Dutch West Indians | 0.0 /100 | #275 | Tragic 6.2% |
| Immigrants | Ghana | 0.0 /100 | #276 | Tragic 6.2% |
| Mexican American Indians | 0.0 /100 | #277 | Tragic 6.2% |
| Immigrants | Barbados | 0.0 /100 | #278 | Tragic 6.2% |
| Immigrants | Portugal | 0.0 /100 | #279 | Tragic 6.3% |
| Guatemalans | 0.0 /100 | #280 | Tragic 6.3% |
| Immigrants | El Salvador | 0.0 /100 | #281 | Tragic 6.3% |
| Immigrants | St. Vincent and the Grenadines | 0.0 /100 | #282 | Tragic 6.3% |
| West Indians | 0.0 /100 | #283 | Tragic 6.3% |
| Immigrants | Grenada | 0.0 /100 | #284 | Tragic 6.3% |
| Bahamians | 0.0 /100 | #285 | Tragic 6.3% |
| Alaskan Athabascans | 0.0 /100 | #286 | Tragic 6.3% |
| Kiowa | 0.0 /100 | #287 | Tragic 6.3% |
| Cree | 0.0 /100 | #288 | Tragic 6.3% |