German Russian vs Apache Unemployment Among Ages 65 to 74 years
COMPARE
German Russian
Apache
Unemployment Among Ages 65 to 74 years
Unemployment Among Ages 65 to 74 years Comparison
German Russians
Apache
5.5%
UNEMPLOYMENT AMONG AGES 65 TO 74 YEARS
1.6/ 100
METRIC RATING
239th/ 347
METRIC RANK
5.5%
UNEMPLOYMENT AMONG AGES 65 TO 74 YEARS
4.5/ 100
METRIC RATING
222nd/ 347
METRIC RANK
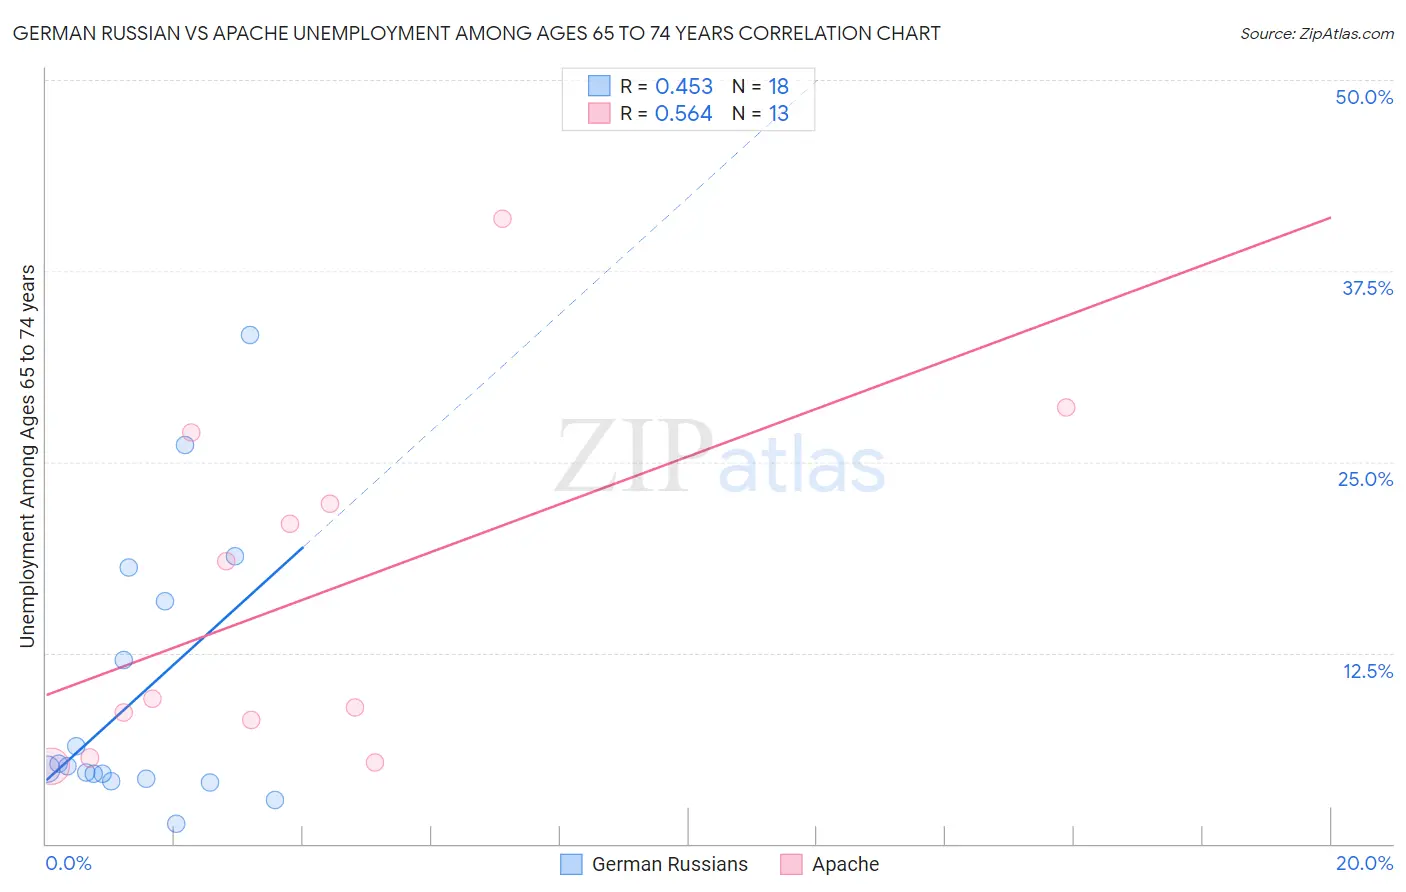
German Russian vs Apache Unemployment Among Ages 65 to 74 years Correlation Chart
The statistical analysis conducted on geographies consisting of 90,944,142 people shows a moderate positive correlation between the proportion of German Russians and unemployment rate among population between the ages 65 and 74 in the United States with a correlation coefficient (R) of 0.453 and weighted average of 5.5%. Similarly, the statistical analysis conducted on geographies consisting of 209,373,151 people shows a substantial positive correlation between the proportion of Apache and unemployment rate among population between the ages 65 and 74 in the United States with a correlation coefficient (R) of 0.564 and weighted average of 5.5%, a difference of 0.85%.
Unemployment Among Ages 65 to 74 years Correlation Summary
| Measurement | German Russian | Apache |
| Minimum | 1.3% | 5.1% |
| Maximum | 33.3% | 40.9% |
| Range | 32.0% | 35.8% |
| Mean | 9.8% | 16.1% |
| Median | 5.0% | 9.5% |
| Interquartile 25% (IQ1) | 4.2% | 6.9% |
| Interquartile 75% (IQ3) | 15.8% | 24.6% |
| Interquartile Range (IQR) | 11.6% | 17.7% |
| Standard Deviation (Sample) | 9.0% | 11.2% |
| Standard Deviation (Population) | 8.8% | 10.8% |
Demographics Similar to German Russians and Apache by Unemployment Among Ages 65 to 74 years
In terms of unemployment among ages 65 to 74 years, the demographic groups most similar to German Russians are Cajun (5.5%, a difference of 0.080%), Ghanaian (5.6%, a difference of 0.10%), Hopi (5.5%, a difference of 0.24%), Immigrants from Belize (5.5%, a difference of 0.24%), and French American Indian (5.5%, a difference of 0.25%). Similarly, the demographic groups most similar to Apache are Hungarian (5.5%, a difference of 0.010%), Spaniard (5.5%, a difference of 0.050%), Immigrants from Uruguay (5.5%, a difference of 0.070%), Immigrants from Trinidad and Tobago (5.5%, a difference of 0.080%), and Immigrants from Syria (5.5%, a difference of 0.090%).
| Demographics | Rating | Rank | Unemployment Among Ages 65 to 74 years |
| Immigrants | Syria | 5.1 /100 | #220 | Tragic 5.5% |
| Spaniards | 4.8 /100 | #221 | Tragic 5.5% |
| Apache | 4.5 /100 | #222 | Tragic 5.5% |
| Hungarians | 4.4 /100 | #223 | Tragic 5.5% |
| Immigrants | Uruguay | 4.2 /100 | #224 | Tragic 5.5% |
| Immigrants | Trinidad and Tobago | 4.1 /100 | #225 | Tragic 5.5% |
| Hondurans | 3.7 /100 | #226 | Tragic 5.5% |
| Immigrants | Albania | 3.7 /100 | #227 | Tragic 5.5% |
| Immigrants | Israel | 3.0 /100 | #228 | Tragic 5.5% |
| West Indians | 2.7 /100 | #229 | Tragic 5.5% |
| Immigrants | Caribbean | 2.7 /100 | #230 | Tragic 5.5% |
| Israelis | 2.5 /100 | #231 | Tragic 5.5% |
| Nigerians | 2.5 /100 | #232 | Tragic 5.5% |
| South American Indians | 2.3 /100 | #233 | Tragic 5.5% |
| French American Indians | 2.2 /100 | #234 | Tragic 5.5% |
| Peruvians | 2.2 /100 | #235 | Tragic 5.5% |
| Hopi | 2.2 /100 | #236 | Tragic 5.5% |
| Immigrants | Belize | 2.2 /100 | #237 | Tragic 5.5% |
| Cajuns | 1.8 /100 | #238 | Tragic 5.5% |
| German Russians | 1.6 /100 | #239 | Tragic 5.5% |
| Ghanaians | 1.4 /100 | #240 | Tragic 5.6% |