German Russian vs Immigrants from El Salvador Female Unemployment
COMPARE
German Russian
Immigrants from El Salvador
Female Unemployment
Female Unemployment Comparison
German Russians
Immigrants from El Salvador
4.9%
FEMALE UNEMPLOYMENT
98.1/ 100
METRIC RATING
71st/ 347
METRIC RANK
6.1%
FEMALE UNEMPLOYMENT
0.0/ 100
METRIC RATING
294th/ 347
METRIC RANK
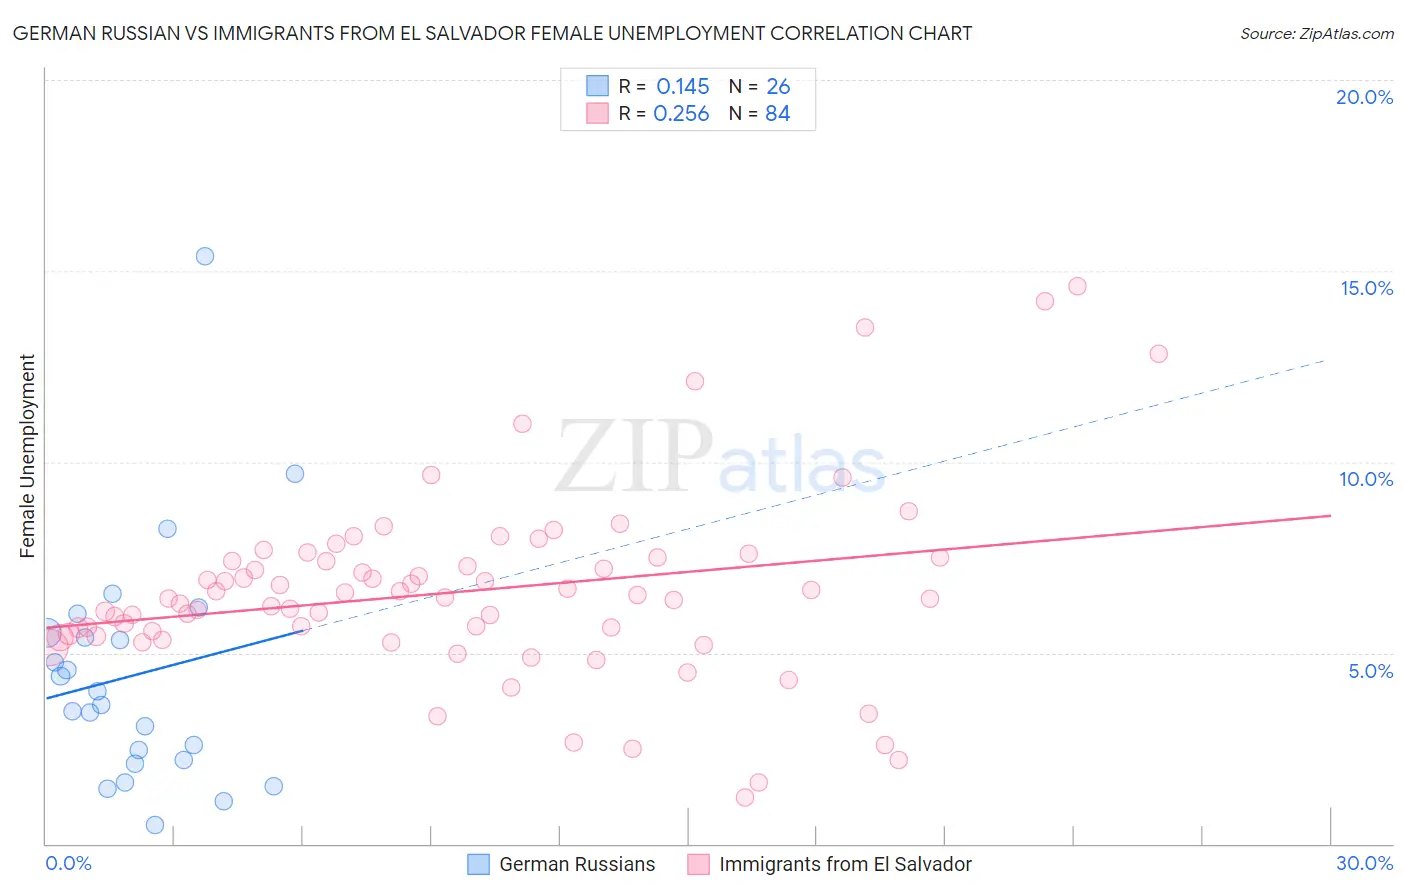
German Russian vs Immigrants from El Salvador Female Unemployment Correlation Chart
The statistical analysis conducted on geographies consisting of 96,182,011 people shows a poor positive correlation between the proportion of German Russians and unemploymnet rate among females in the United States with a correlation coefficient (R) of 0.145 and weighted average of 4.9%. Similarly, the statistical analysis conducted on geographies consisting of 356,565,634 people shows a weak positive correlation between the proportion of Immigrants from El Salvador and unemploymnet rate among females in the United States with a correlation coefficient (R) of 0.256 and weighted average of 6.1%, a difference of 23.6%.
Female Unemployment Correlation Summary
| Measurement | German Russian | Immigrants from El Salvador |
| Minimum | 0.50% | 1.2% |
| Maximum | 15.4% | 14.6% |
| Range | 14.9% | 13.4% |
| Mean | 4.4% | 6.6% |
| Median | 3.8% | 6.4% |
| Interquartile 25% (IQ1) | 2.2% | 5.5% |
| Interquartile 75% (IQ3) | 5.5% | 7.5% |
| Interquartile Range (IQR) | 3.3% | 2.0% |
| Standard Deviation (Sample) | 3.2% | 2.4% |
| Standard Deviation (Population) | 3.1% | 2.4% |
Similar Demographics by Female Unemployment
Demographics Similar to German Russians by Female Unemployment
In terms of female unemployment, the demographic groups most similar to German Russians are Immigrants from Northern Europe (4.9%, a difference of 0.070%), Osage (4.9%, a difference of 0.080%), Russian (5.0%, a difference of 0.10%), Immigrants from Bolivia (5.0%, a difference of 0.11%), and Immigrants from Ireland (4.9%, a difference of 0.12%).
| Demographics | Rating | Rank | Female Unemployment |
| Celtics | 98.5 /100 | #64 | Exceptional 4.9% |
| Immigrants | North America | 98.3 /100 | #65 | Exceptional 4.9% |
| Hungarians | 98.3 /100 | #66 | Exceptional 4.9% |
| Cubans | 98.3 /100 | #67 | Exceptional 4.9% |
| Tlingit-Haida | 98.3 /100 | #68 | Exceptional 4.9% |
| Immigrants | Ireland | 98.2 /100 | #69 | Exceptional 4.9% |
| Osage | 98.2 /100 | #70 | Exceptional 4.9% |
| German Russians | 98.1 /100 | #71 | Exceptional 4.9% |
| Immigrants | Northern Europe | 98.0 /100 | #72 | Exceptional 4.9% |
| Russians | 98.0 /100 | #73 | Exceptional 5.0% |
| Immigrants | Bolivia | 98.0 /100 | #74 | Exceptional 5.0% |
| Immigrants | Singapore | 98.0 /100 | #75 | Exceptional 5.0% |
| Immigrants | Venezuela | 97.9 /100 | #76 | Exceptional 5.0% |
| Mongolians | 97.8 /100 | #77 | Exceptional 5.0% |
| Immigrants | Netherlands | 97.8 /100 | #78 | Exceptional 5.0% |
Demographics Similar to Immigrants from El Salvador by Female Unemployment
In terms of female unemployment, the demographic groups most similar to Immigrants from El Salvador are Mexican (6.1%, a difference of 0.10%), Immigrants from Latin America (6.1%, a difference of 0.10%), Alaskan Athabascan (6.1%, a difference of 0.12%), West Indian (6.1%, a difference of 0.13%), and Jamaican (6.1%, a difference of 0.16%).
| Demographics | Rating | Rank | Female Unemployment |
| Immigrants | Guatemala | 0.0 /100 | #287 | Tragic 6.1% |
| Haitians | 0.0 /100 | #288 | Tragic 6.1% |
| Trinidadians and Tobagonians | 0.0 /100 | #289 | Tragic 6.1% |
| Immigrants | Caribbean | 0.0 /100 | #290 | Tragic 6.1% |
| Immigrants | West Indies | 0.0 /100 | #291 | Tragic 6.1% |
| Immigrants | Trinidad and Tobago | 0.0 /100 | #292 | Tragic 6.1% |
| Mexicans | 0.0 /100 | #293 | Tragic 6.1% |
| Immigrants | El Salvador | 0.0 /100 | #294 | Tragic 6.1% |
| Immigrants | Latin America | 0.0 /100 | #295 | Tragic 6.1% |
| Alaskan Athabascans | 0.0 /100 | #296 | Tragic 6.1% |
| West Indians | 0.0 /100 | #297 | Tragic 6.1% |
| Jamaicans | 0.0 /100 | #298 | Tragic 6.1% |
| Ute | 0.0 /100 | #299 | Tragic 6.1% |
| Immigrants | Haiti | 0.0 /100 | #300 | Tragic 6.1% |
| Immigrants | Barbados | 0.0 /100 | #301 | Tragic 6.2% |