German Russian vs Apache Kindergarten
COMPARE
German Russian
Apache
Kindergarten
Kindergarten Comparison
German Russians
Apache
98.2%
KINDERGARTEN
97.1/ 100
METRIC RATING
109th/ 347
METRIC RANK
98.0%
KINDERGARTEN
75.0/ 100
METRIC RATING
148th/ 347
METRIC RANK
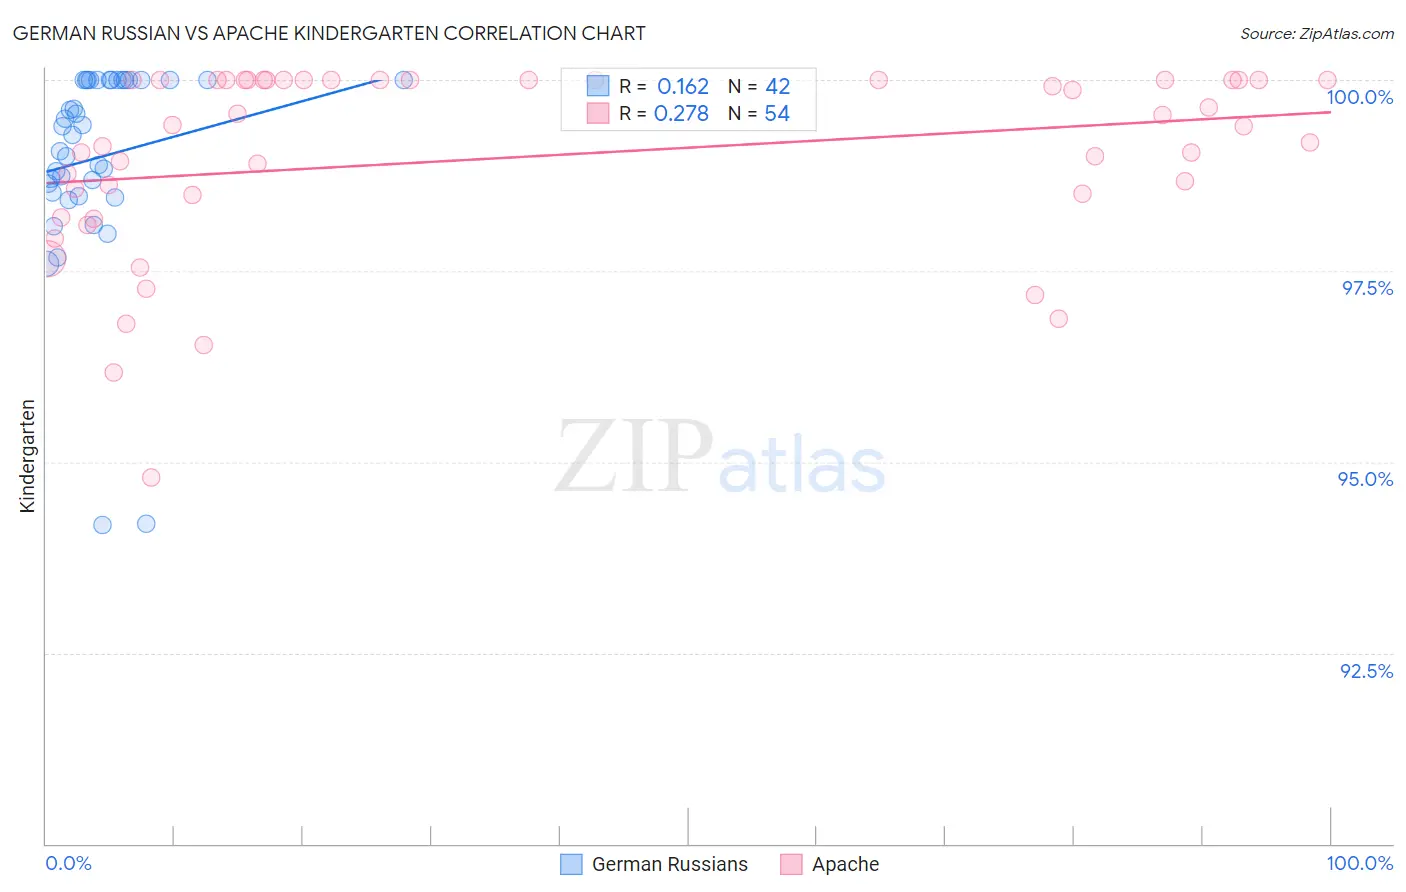
German Russian vs Apache Kindergarten Correlation Chart
The statistical analysis conducted on geographies consisting of 96,461,520 people shows a poor positive correlation between the proportion of German Russians and percentage of population with at least kindergarten education in the United States with a correlation coefficient (R) of 0.162 and weighted average of 98.2%. Similarly, the statistical analysis conducted on geographies consisting of 231,142,814 people shows a weak positive correlation between the proportion of Apache and percentage of population with at least kindergarten education in the United States with a correlation coefficient (R) of 0.278 and weighted average of 98.0%, a difference of 0.19%.
Kindergarten Correlation Summary
| Measurement | German Russian | Apache |
| Minimum | 94.2% | 94.8% |
| Maximum | 100.0% | 100.0% |
| Range | 5.8% | 5.2% |
| Mean | 99.0% | 99.0% |
| Median | 99.3% | 99.4% |
| Interquartile 25% (IQ1) | 98.5% | 98.5% |
| Interquartile 75% (IQ3) | 100.0% | 100.0% |
| Interquartile Range (IQR) | 1.5% | 1.5% |
| Standard Deviation (Sample) | 1.3% | 1.2% |
| Standard Deviation (Population) | 1.3% | 1.2% |
Similar Demographics by Kindergarten
Demographics Similar to German Russians by Kindergarten
In terms of kindergarten, the demographic groups most similar to German Russians are Immigrants from Switzerland (98.2%, a difference of 0.0%), Bhutanese (98.2%, a difference of 0.010%), Pima (98.2%, a difference of 0.010%), Basque (98.2%, a difference of 0.010%), and Turkish (98.2%, a difference of 0.010%).
| Demographics | Rating | Rank | Kindergarten |
| Cree | 97.7 /100 | #102 | Exceptional 98.2% |
| Immigrants | Ireland | 97.6 /100 | #103 | Exceptional 98.2% |
| Bhutanese | 97.3 /100 | #104 | Exceptional 98.2% |
| Pima | 97.3 /100 | #105 | Exceptional 98.2% |
| Basques | 97.3 /100 | #106 | Exceptional 98.2% |
| Turks | 97.3 /100 | #107 | Exceptional 98.2% |
| Immigrants | Switzerland | 97.2 /100 | #108 | Exceptional 98.2% |
| German Russians | 97.1 /100 | #109 | Exceptional 98.2% |
| Immigrants | Singapore | 96.8 /100 | #110 | Exceptional 98.2% |
| Immigrants | Norway | 96.6 /100 | #111 | Exceptional 98.2% |
| Immigrants | Czechoslovakia | 96.6 /100 | #112 | Exceptional 98.2% |
| Immigrants | Latvia | 96.3 /100 | #113 | Exceptional 98.2% |
| Ute | 96.3 /100 | #114 | Exceptional 98.2% |
| Iranians | 96.2 /100 | #115 | Exceptional 98.2% |
| Spanish | 95.8 /100 | #116 | Exceptional 98.2% |
Demographics Similar to Apache by Kindergarten
In terms of kindergarten, the demographic groups most similar to Apache are Immigrants from Greece (98.0%, a difference of 0.0%), Filipino (98.0%, a difference of 0.010%), Immigrants from Israel (98.0%, a difference of 0.010%), Jordanian (98.0%, a difference of 0.010%), and Alsatian (98.1%, a difference of 0.020%).
| Demographics | Rating | Rank | Kindergarten |
| Marshallese | 83.0 /100 | #141 | Excellent 98.1% |
| Immigrants | Turkey | 82.8 /100 | #142 | Excellent 98.1% |
| Burmese | 81.5 /100 | #143 | Excellent 98.1% |
| Alsatians | 80.4 /100 | #144 | Excellent 98.1% |
| Hmong | 78.8 /100 | #145 | Good 98.1% |
| Filipinos | 78.3 /100 | #146 | Good 98.0% |
| Immigrants | Israel | 77.6 /100 | #147 | Good 98.0% |
| Apache | 75.0 /100 | #148 | Good 98.0% |
| Immigrants | Greece | 74.9 /100 | #149 | Good 98.0% |
| Jordanians | 72.8 /100 | #150 | Good 98.0% |
| Soviet Union | 70.8 /100 | #151 | Good 98.0% |
| Dutch West Indians | 70.1 /100 | #152 | Good 98.0% |
| Immigrants | Moldova | 69.1 /100 | #153 | Good 98.0% |
| Immigrants | Iran | 68.8 /100 | #154 | Good 98.0% |
| Comanche | 68.3 /100 | #155 | Good 98.0% |