French vs Taiwanese Unemployment Among Women with Children Under 18 years

COMPARE

French
Race
Ancestry
AfghanAfricanAlaska NativeAlaskan AthabascanAlbanianAleutAlsatianAmericanApacheArabArapahoArgentineanArmenianAssyrian/Chaldean/SyriacAustralianAustrianBahamianBangladeshiBarbadianBasqueBelgianBelizeanBermudanBhutaneseBlackfeetBolivianBrazilianBritishBritish West IndianBulgarianBurmeseCajunCambodianCanadianCape VerdeanCarpatho RusynCelticCentral AmericanCentral American IndianCherokeeCheyenneChickasawChileanChineseChippewaChoctawColombianColvilleComancheCosta RicanCreeCreekCroatianCrowCubanCypriotCzechCzechoslovakianDanishDelawareDominicanDutchDutch West IndianEastern EuropeanEcuadorianEgyptianEnglishEstonianEthiopianEuropeanFijianFilipinoFinnishFrenchFrench American IndianFrench CanadianGermanGerman RussianGhanaianGreekGuamanian/ChamorroGuatemalanGuyaneseHaitianHmongHonduranHopiHoumaHungarianIcelanderIndian (Asian)IndonesianInupiatIranianIraqiIrishIroquoisIsraeliItalianJamaicanJapaneseJordanianKenyanKiowaKoreanLaotianLatvianLebaneseLiberianLithuanianLumbeeLuxembourgerMacedonianMalaysianMalteseMarshalleseMenomineeMexicanMexican American IndianMongolianMoroccanNative HawaiianNavajoNepaleseNew ZealanderNicaraguanNigerianNorthern EuropeanNorwegianOkinawanOsageOttawaPaiutePakistaniPalestinianPanamanianParaguayanPennsylvania GermanPeruvianPimaPolishPortuguesePotawatomiPuebloPuerto RicanPuget Sound SalishRomanianRussianSalvadoranSamoanScandinavianScotch-IrishScottishSeminoleSenegaleseSerbianShoshoneSierra LeoneanSiouxSlavicSlovakSloveneSomaliSouth AfricanSouth AmericanSouth American IndianSoviet UnionSpaniardSpanishSpanish AmericanSpanish American IndianSri LankanSubsaharan AfricanSudaneseSwedishSwissSyrianThaiTlingit-HaidaTohono O'OdhamTonganTrinidadian and TobagonianTsimshianTurkishU.S. Virgin IslanderUgandanUkrainianUruguayanUteVenezuelanVietnameseWelshWest IndianYakamaYaquiYugoslavianYumanYup'ikZimbabwean
Immigration
NonimmigrantsImmigrantsAfghanistanAfricaAlbaniaArgentinaArmeniaAsiaAustraliaAustriaBahamasBangladeshBarbadosBelarusBelgiumBelizeBoliviaBosnia and HerzegovinaBrazilBulgariaBurma/MyanmarCabo VerdeCambodiaCameroonCanadaCaribbeanCentral AmericaChileChinaColombiaCongoCosta RicaCroatiaCubaCzechoslovakiaDenmarkDominicaDominican RepublicEastern AfricaEastern AsiaEastern EuropeEcuadorEgyptEl SalvadorEnglandEritreaEthiopiaEuropeFijiFranceGermanyGhanaGreeceGrenadaGuatemalaGuyanaHaitiHondurasHong KongHungaryIndiaIndonesiaIranIraqIrelandIsraelItalyJamaicaJapanJordanKazakhstanKenyaKoreaKuwaitLaosLatin AmericaLatviaLebanonLiberiaLithuaniaMalaysiaMexicoMicronesiaMiddle AfricaMoldovaMoroccoNepalNetherlandsNicaraguaNigeriaNorth AmericaNorth MacedoniaNorthern AfricaNorthern EuropeNorwayOceaniaPakistanPanamaPeruPhilippinesPolandPortugalRomaniaRussiaSaudi ArabiaScotlandSenegalSerbiaSierra LeoneSingaporeSomaliaSouth AfricaSouth AmericaSouth Central AsiaSouth Eastern AsiaSouthern EuropeSpainSri LankaSt. Vincent and the GrenadinesSudanSwedenSwitzerlandSyriaTaiwanThailandTrinidad and TobagoTurkeyUgandaUkraineUruguayUzbekistanVenezuelaVietnamWest IndiesWestern AfricaWestern AsiaWestern EuropeYemenZaireZimbabweAzores
Taiwanese
Race
Ancestry
AfghanAfricanAlaska NativeAlaskan AthabascanAlbanianAleutAlsatianAmericanApacheArabArapahoArgentineanArmenianAssyrian/Chaldean/SyriacAustralianAustrianBahamianBangladeshiBarbadianBasqueBelgianBelizeanBermudanBhutaneseBlackfeetBolivianBrazilianBritishBritish West IndianBulgarianBurmeseCajunCambodianCanadianCape VerdeanCarpatho RusynCelticCentral AmericanCentral American IndianCherokeeCheyenneChickasawChileanChineseChippewaChoctawColombianColvilleComancheCosta RicanCreeCreekCroatianCrowCubanCypriotCzechCzechoslovakianDanishDelawareDominicanDutchDutch West IndianEastern EuropeanEcuadorianEgyptianEnglishEstonianEthiopianEuropeanFijianFilipinoFinnishFrench American IndianFrench CanadianGermanGerman RussianGhanaianGreekGuamanian/ChamorroGuatemalanGuyaneseHaitianHmongHonduranHopiHoumaHungarianIcelanderIndian (Asian)IndonesianInupiatIranianIraqiIrishIroquoisIsraeliItalianJamaicanJapaneseJordanianKenyanKiowaKoreanLaotianLatvianLebaneseLiberianLithuanianLumbeeLuxembourgerMacedonianMalaysianMalteseMarshalleseMenomineeMexicanMexican American IndianMongolianMoroccanNative HawaiianNavajoNepaleseNew ZealanderNicaraguanNigerianNorthern EuropeanNorwegianOkinawanOsageOttawaPaiutePakistaniPalestinianPanamanianParaguayanPennsylvania GermanPeruvianPimaPolishPortuguesePotawatomiPuebloPuerto RicanPuget Sound SalishRomanianRussianSalvadoranSamoanScandinavianScotch-IrishScottishSeminoleSenegaleseSerbianShoshoneSierra LeoneanSiouxSlavicSlovakSloveneSomaliSouth AfricanSouth AmericanSouth American IndianSoviet UnionSpaniardSpanishSpanish AmericanSpanish American IndianSri LankanSubsaharan AfricanSudaneseSwedishSwissSyrianTaiwaneseThaiTlingit-HaidaTohono O'OdhamTonganTrinidadian and TobagonianTsimshianTurkishU.S. Virgin IslanderUgandanUkrainianUruguayanUteVenezuelanVietnameseWelshWest IndianYakamaYaquiYugoslavianYumanYup'ikZimbabwean
Immigration
NonimmigrantsImmigrantsAfghanistanAfricaAlbaniaArgentinaArmeniaAsiaAustraliaAustriaBahamasBangladeshBarbadosBelarusBelgiumBelizeBoliviaBosnia and HerzegovinaBrazilBulgariaBurma/MyanmarCabo VerdeCambodiaCameroonCanadaCaribbeanCentral AmericaChileChinaColombiaCongoCosta RicaCroatiaCubaCzechoslovakiaDenmarkDominicaDominican RepublicEastern AfricaEastern AsiaEastern EuropeEcuadorEgyptEl SalvadorEnglandEritreaEthiopiaEuropeFijiFranceGermanyGhanaGreeceGrenadaGuatemalaGuyanaHaitiHondurasHong KongHungaryIndiaIndonesiaIranIraqIrelandIsraelItalyJamaicaJapanJordanKazakhstanKenyaKoreaKuwaitLaosLatin AmericaLatviaLebanonLiberiaLithuaniaMalaysiaMexicoMicronesiaMiddle AfricaMoldovaMoroccoNepalNetherlandsNicaraguaNigeriaNorth AmericaNorth MacedoniaNorthern AfricaNorthern EuropeNorwayOceaniaPakistanPanamaPeruPhilippinesPolandPortugalRomaniaRussiaSaudi ArabiaScotlandSenegalSerbiaSierra LeoneSingaporeSomaliaSouth AfricaSouth AmericaSouth Central AsiaSouth Eastern AsiaSouthern EuropeSpainSri LankaSt. Vincent and the GrenadinesSudanSwedenSwitzerlandSyriaTaiwanThailandTrinidad and TobagoTurkeyUgandaUkraineUruguayUzbekistanVenezuelaVietnamWest IndiesWestern AfricaWestern AsiaWestern EuropeYemenZaireZimbabweAzores
Unemployment Among Women with Children Under 18 years
Income
Poverty
Unemployment
Labor Participation
Family Structure
Vehicle Availability
Education Level
Disability

Unemployment Among Women with Children Under 18 years Comparison

French

Taiwanese

Excellent
Exceptional
5.2%
UNEMPLOYMENT AMONG WOMEN WITH CHILDREN UNDER 18 YEARS
88.4/ 100
METRIC RATING
113th/ 347
METRIC RANK
4.8%
UNEMPLOYMENT AMONG WOMEN WITH CHILDREN UNDER 18 YEARS
99.8/ 100
METRIC RATING
16th/ 347
METRIC RANK

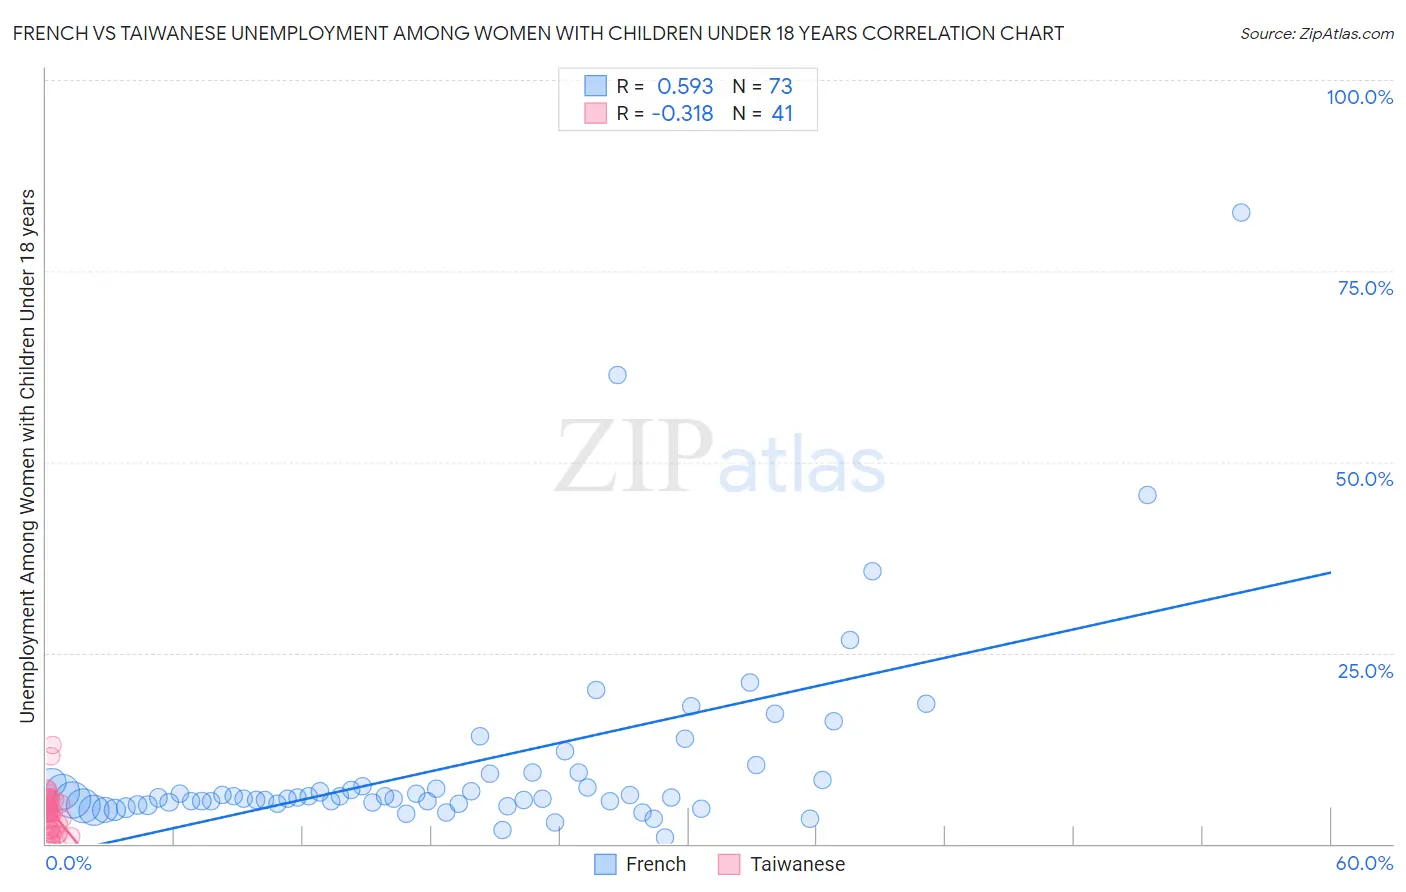
French vs Taiwanese Unemployment Among Women with Children Under 18 years Correlation Chart

The statistical analysis conducted on geographies consisting of 516,708,642 people shows a substantial positive correlation between the proportion of French and unemployment rate among women with children under the age of 18 in the United States with a correlation coefficient (R) of 0.593 and weighted average of 5.2%. Similarly, the statistical analysis conducted on geographies consisting of 31,614,590 people shows a mild negative correlation between the proportion of Taiwanese and unemployment rate among women with children under the age of 18 in the United States with a correlation coefficient (R) of -0.318 and weighted average of 4.8%, a difference of 8.4%.
French vs Taiwanese Unemployment Among Women with Children Under 18 years

Unemployment Among Women with Children Under 18 years Correlation Summary

MeasurementFrenchTaiwanese
Minimum0.90%0.10%
Maximum82.7%13.0%
Range81.8%12.9%
Mean10.2%4.2%
Median6.0%4.3%
Interquartile 25% (IQ1)5.2%1.8%
Interquartile 75% (IQ3)8.8%5.7%
Interquartile Range (IQR)3.5%3.9%
Standard Deviation (Sample)12.8%2.7%
Standard Deviation (Population)12.7%2.6%

Similar Demographics by Unemployment Among Women with Children Under 18 years

Demographics Similar to French by Unemployment Among Women with Children Under 18 years

In terms of unemployment among women with children under 18 years, the demographic groups most similar to French are Immigrants from Eastern Europe (5.2%, a difference of 0.010%), Kenyan (5.3%, a difference of 0.040%), Hungarian (5.3%, a difference of 0.050%), Immigrants from Czechoslovakia (5.2%, a difference of 0.090%), and French Canadian (5.2%, a difference of 0.090%).
DemographicsRating | RankUnemployment Among Women with Children Under 18 years
Pakistanis
89.9
/100
|
#106
Excellent
5.2%
Slavs
89.8
/100
|
#107
Excellent
5.2%
Iranians
89.7
/100
|
#108
Excellent
5.2%
Immigrants | Russia
89.0
/100
|
#109
Excellent
5.2%
Immigrants | Czechoslovakia
88.9
/100
|
#110
Excellent
5.2%
French Canadians
88.9
/100
|
#111
Excellent
5.2%
Immigrants | Eastern Europe
88.5
/100
|
#112
Excellent
5.2%
French
88.4
/100
|
#113
Excellent
5.2%
Kenyans
88.2
/100
|
#114
Excellent
5.3%
Hungarians
88.1
/100
|
#115
Excellent
5.3%
Macedonians
87.7
/100
|
#116
Excellent
5.3%
Canadians
87.4
/100
|
#117
Excellent
5.3%
Immigrants | Europe
86.7
/100
|
#118
Excellent
5.3%
Basques
86.5
/100
|
#119
Excellent
5.3%
Egyptians
86.4
/100
|
#120
Excellent
5.3%

Demographics Similar to Taiwanese by Unemployment Among Women with Children Under 18 years

In terms of unemployment among women with children under 18 years, the demographic groups most similar to Taiwanese are Immigrants from Singapore (4.9%, a difference of 0.20%), Slovene (4.9%, a difference of 0.31%), Thai (4.8%, a difference of 0.46%), German (4.9%, a difference of 0.46%), and Latvian (4.9%, a difference of 0.58%).
DemographicsRating | RankUnemployment Among Women with Children Under 18 years
Okinawans
99.9
/100
|
#9
Exceptional
4.7%
Czechs
99.9
/100
|
#10
Exceptional
4.7%
Filipinos
99.9
/100
|
#11
Exceptional
4.8%
Scandinavians
99.9
/100
|
#12
Exceptional
4.8%
Bulgarians
99.9
/100
|
#13
Exceptional
4.8%
Cambodians
99.9
/100
|
#14
Exceptional
4.8%
Thais
99.8
/100
|
#15
Exceptional
4.8%
Taiwanese
99.8
/100
|
#16
Exceptional
4.8%
Immigrants | Singapore
99.8
/100
|
#17
Exceptional
4.9%
Slovenes
99.8
/100
|
#18
Exceptional
4.9%
Germans
99.8
/100
|
#19
Exceptional
4.9%
Latvians
99.7
/100
|
#20
Exceptional
4.9%
Europeans
99.6
/100
|
#21
Exceptional
4.9%
Indians (Asian)
99.6
/100
|
#22
Exceptional
4.9%
Immigrants | China
99.6
/100
|
#23
Exceptional
4.9%