Guatemalan vs Taiwanese Unemployment Among Women with Children Under 18 years
COMPARE
Guatemalan
Taiwanese
Unemployment Among Women with Children Under 18 years
Unemployment Among Women with Children Under 18 years Comparison
Guatemalans
Taiwanese
6.3%
UNEMPLOYMENT AMONG WOMEN WITH CHILDREN UNDER 18 YEARS
0.0/ 100
METRIC RATING
280th/ 347
METRIC RANK
4.8%
UNEMPLOYMENT AMONG WOMEN WITH CHILDREN UNDER 18 YEARS
99.8/ 100
METRIC RATING
16th/ 347
METRIC RANK
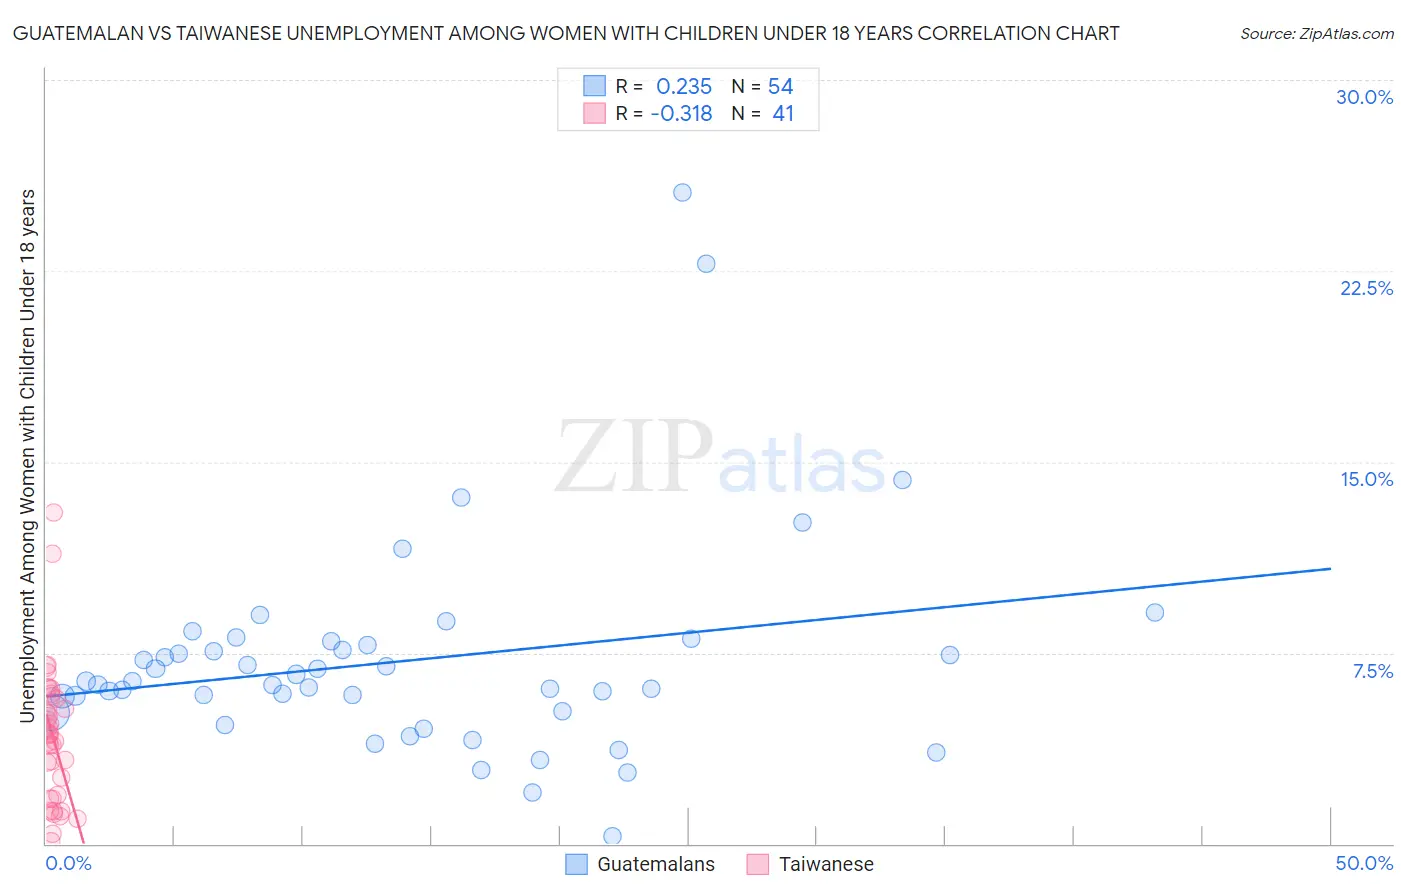
Guatemalan vs Taiwanese Unemployment Among Women with Children Under 18 years Correlation Chart
The statistical analysis conducted on geographies consisting of 395,043,654 people shows a weak positive correlation between the proportion of Guatemalans and unemployment rate among women with children under the age of 18 in the United States with a correlation coefficient (R) of 0.235 and weighted average of 6.3%. Similarly, the statistical analysis conducted on geographies consisting of 31,614,590 people shows a mild negative correlation between the proportion of Taiwanese and unemployment rate among women with children under the age of 18 in the United States with a correlation coefficient (R) of -0.318 and weighted average of 4.8%, a difference of 29.8%.
Unemployment Among Women with Children Under 18 years Correlation Summary
| Measurement | Guatemalan | Taiwanese |
| Minimum | 0.30% | 0.10% |
| Maximum | 25.6% | 13.0% |
| Range | 25.3% | 12.9% |
| Mean | 7.2% | 4.2% |
| Median | 6.3% | 4.3% |
| Interquartile 25% (IQ1) | 5.2% | 1.8% |
| Interquartile 75% (IQ3) | 7.8% | 5.7% |
| Interquartile Range (IQR) | 2.6% | 3.9% |
| Standard Deviation (Sample) | 4.3% | 2.7% |
| Standard Deviation (Population) | 4.2% | 2.6% |
Similar Demographics by Unemployment Among Women with Children Under 18 years
Demographics Similar to Guatemalans by Unemployment Among Women with Children Under 18 years
In terms of unemployment among women with children under 18 years, the demographic groups most similar to Guatemalans are Immigrants from El Salvador (6.3%, a difference of 0.16%), Immigrants from St. Vincent and the Grenadines (6.3%, a difference of 0.17%), West Indian (6.3%, a difference of 0.36%), Immigrants from Grenada (6.3%, a difference of 0.39%), and Immigrants from Portugal (6.3%, a difference of 0.50%).
| Demographics | Rating | Rank | Unemployment Among Women with Children Under 18 years |
| Immigrants | Western Africa | 0.0 /100 | #273 | Tragic 6.2% |
| Senegalese | 0.0 /100 | #274 | Tragic 6.2% |
| Dutch West Indians | 0.0 /100 | #275 | Tragic 6.2% |
| Immigrants | Ghana | 0.0 /100 | #276 | Tragic 6.2% |
| Mexican American Indians | 0.0 /100 | #277 | Tragic 6.2% |
| Immigrants | Barbados | 0.0 /100 | #278 | Tragic 6.2% |
| Immigrants | Portugal | 0.0 /100 | #279 | Tragic 6.3% |
| Guatemalans | 0.0 /100 | #280 | Tragic 6.3% |
| Immigrants | El Salvador | 0.0 /100 | #281 | Tragic 6.3% |
| Immigrants | St. Vincent and the Grenadines | 0.0 /100 | #282 | Tragic 6.3% |
| West Indians | 0.0 /100 | #283 | Tragic 6.3% |
| Immigrants | Grenada | 0.0 /100 | #284 | Tragic 6.3% |
| Bahamians | 0.0 /100 | #285 | Tragic 6.3% |
| Alaskan Athabascans | 0.0 /100 | #286 | Tragic 6.3% |
| Kiowa | 0.0 /100 | #287 | Tragic 6.3% |
Demographics Similar to Taiwanese by Unemployment Among Women with Children Under 18 years
In terms of unemployment among women with children under 18 years, the demographic groups most similar to Taiwanese are Immigrants from Singapore (4.9%, a difference of 0.20%), Slovene (4.9%, a difference of 0.31%), Thai (4.8%, a difference of 0.46%), German (4.9%, a difference of 0.46%), and Latvian (4.9%, a difference of 0.58%).
| Demographics | Rating | Rank | Unemployment Among Women with Children Under 18 years |
| Okinawans | 99.9 /100 | #9 | Exceptional 4.7% |
| Czechs | 99.9 /100 | #10 | Exceptional 4.7% |
| Filipinos | 99.9 /100 | #11 | Exceptional 4.8% |
| Scandinavians | 99.9 /100 | #12 | Exceptional 4.8% |
| Bulgarians | 99.9 /100 | #13 | Exceptional 4.8% |
| Cambodians | 99.9 /100 | #14 | Exceptional 4.8% |
| Thais | 99.8 /100 | #15 | Exceptional 4.8% |
| Taiwanese | 99.8 /100 | #16 | Exceptional 4.8% |
| Immigrants | Singapore | 99.8 /100 | #17 | Exceptional 4.9% |
| Slovenes | 99.8 /100 | #18 | Exceptional 4.9% |
| Germans | 99.8 /100 | #19 | Exceptional 4.9% |
| Latvians | 99.7 /100 | #20 | Exceptional 4.9% |
| Europeans | 99.6 /100 | #21 | Exceptional 4.9% |
| Indians (Asian) | 99.6 /100 | #22 | Exceptional 4.9% |
| Immigrants | China | 99.6 /100 | #23 | Exceptional 4.9% |