Filipino vs Immigrants from Israel Unemployment Among Women with Children Under 18 years
COMPARE
Filipino
Immigrants from Israel
Unemployment Among Women with Children Under 18 years
Unemployment Among Women with Children Under 18 years Comparison
Filipinos
Immigrants from Israel
4.8%
UNEMPLOYMENT AMONG WOMEN WITH CHILDREN UNDER 18 YEARS
99.9/ 100
METRIC RATING
11th/ 347
METRIC RANK
5.3%
UNEMPLOYMENT AMONG WOMEN WITH CHILDREN UNDER 18 YEARS
81.9/ 100
METRIC RATING
131st/ 347
METRIC RANK
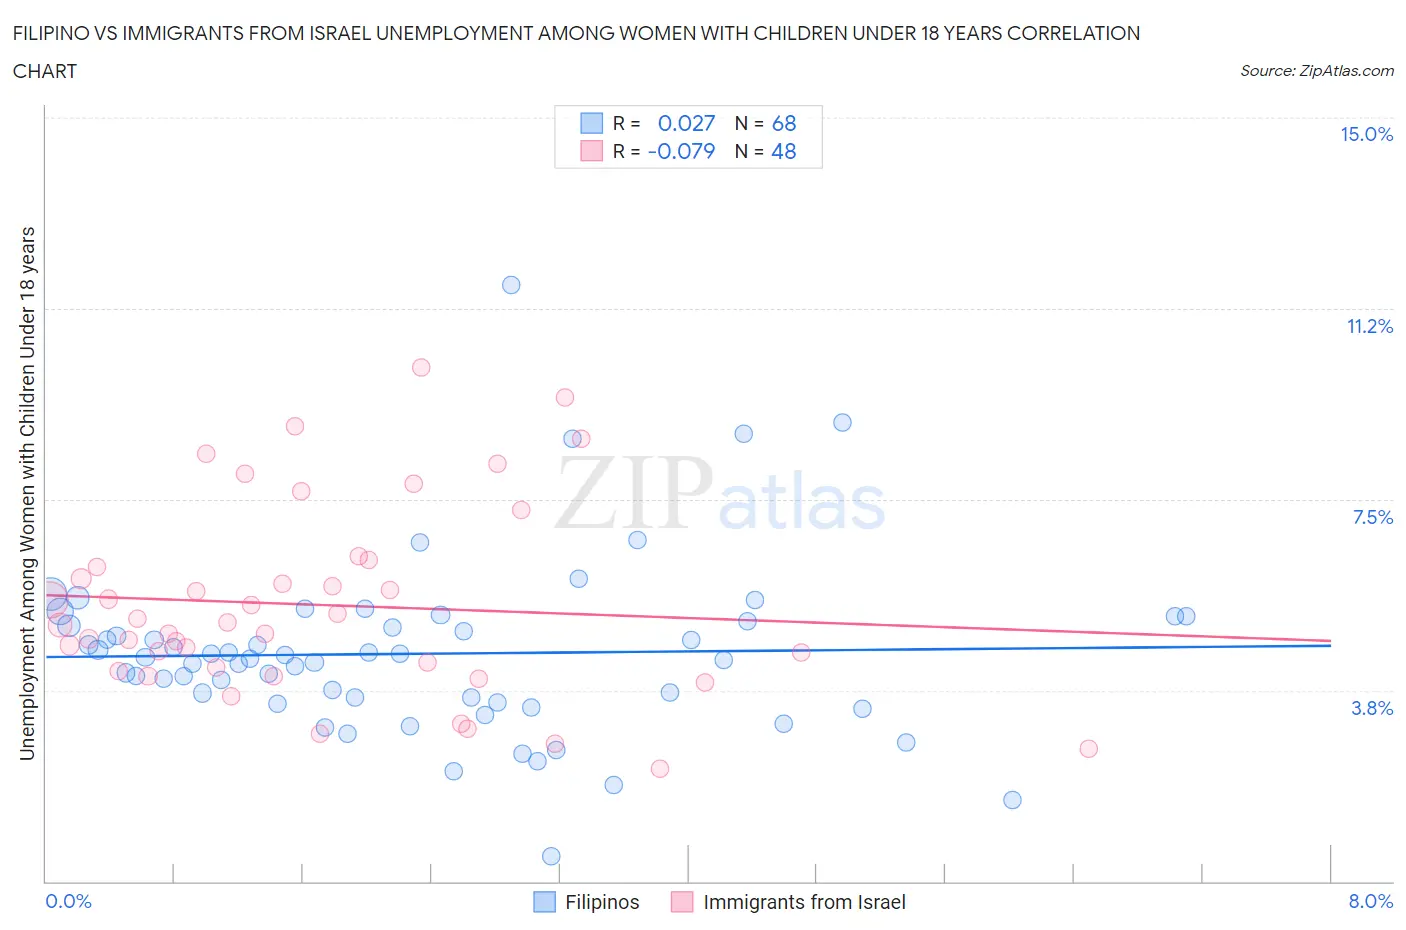
Filipino vs Immigrants from Israel Unemployment Among Women with Children Under 18 years Correlation Chart
The statistical analysis conducted on geographies consisting of 248,445,942 people shows no correlation between the proportion of Filipinos and unemployment rate among women with children under the age of 18 in the United States with a correlation coefficient (R) of 0.027 and weighted average of 4.8%. Similarly, the statistical analysis conducted on geographies consisting of 205,523,587 people shows a slight negative correlation between the proportion of Immigrants from Israel and unemployment rate among women with children under the age of 18 in the United States with a correlation coefficient (R) of -0.079 and weighted average of 5.3%, a difference of 11.5%.
Unemployment Among Women with Children Under 18 years Correlation Summary
| Measurement | Filipino | Immigrants from Israel |
| Minimum | 0.50% | 2.2% |
| Maximum | 11.7% | 10.1% |
| Range | 11.2% | 7.9% |
| Mean | 4.5% | 5.4% |
| Median | 4.4% | 5.1% |
| Interquartile 25% (IQ1) | 3.5% | 4.2% |
| Interquartile 75% (IQ3) | 5.1% | 6.2% |
| Interquartile Range (IQR) | 1.5% | 2.1% |
| Standard Deviation (Sample) | 1.7% | 1.9% |
| Standard Deviation (Population) | 1.7% | 1.9% |
Similar Demographics by Unemployment Among Women with Children Under 18 years
Demographics Similar to Filipinos by Unemployment Among Women with Children Under 18 years
In terms of unemployment among women with children under 18 years, the demographic groups most similar to Filipinos are Czech (4.7%, a difference of 0.45%), Okinawan (4.7%, a difference of 0.46%), Scandinavian (4.8%, a difference of 0.46%), Bulgarian (4.8%, a difference of 0.97%), and Immigrants from Hong Kong (4.7%, a difference of 1.3%).
| Demographics | Rating | Rank | Unemployment Among Women with Children Under 18 years |
| Swedes | 100.0 /100 | #4 | Exceptional 4.7% |
| Tongans | 100.0 /100 | #5 | Exceptional 4.7% |
| Immigrants | Taiwan | 100.0 /100 | #6 | Exceptional 4.7% |
| Immigrants | India | 100.0 /100 | #7 | Exceptional 4.7% |
| Immigrants | Hong Kong | 100.0 /100 | #8 | Exceptional 4.7% |
| Okinawans | 99.9 /100 | #9 | Exceptional 4.7% |
| Czechs | 99.9 /100 | #10 | Exceptional 4.7% |
| Filipinos | 99.9 /100 | #11 | Exceptional 4.8% |
| Scandinavians | 99.9 /100 | #12 | Exceptional 4.8% |
| Bulgarians | 99.9 /100 | #13 | Exceptional 4.8% |
| Cambodians | 99.9 /100 | #14 | Exceptional 4.8% |
| Thais | 99.8 /100 | #15 | Exceptional 4.8% |
| Taiwanese | 99.8 /100 | #16 | Exceptional 4.8% |
| Immigrants | Singapore | 99.8 /100 | #17 | Exceptional 4.9% |
| Slovenes | 99.8 /100 | #18 | Exceptional 4.9% |
Demographics Similar to Immigrants from Israel by Unemployment Among Women with Children Under 18 years
In terms of unemployment among women with children under 18 years, the demographic groups most similar to Immigrants from Israel are Immigrants from Austria (5.3%, a difference of 0.020%), Immigrants from Italy (5.3%, a difference of 0.050%), Immigrants from Ethiopia (5.3%, a difference of 0.070%), Immigrants from South Africa (5.3%, a difference of 0.11%), and White/Caucasian (5.3%, a difference of 0.12%).
| Demographics | Rating | Rank | Unemployment Among Women with Children Under 18 years |
| Native Hawaiians | 84.0 /100 | #124 | Excellent 5.3% |
| Immigrants | North Macedonia | 83.2 /100 | #125 | Excellent 5.3% |
| Immigrants | Oceania | 83.1 /100 | #126 | Excellent 5.3% |
| Whites/Caucasians | 82.9 /100 | #127 | Excellent 5.3% |
| Immigrants | South Africa | 82.8 /100 | #128 | Excellent 5.3% |
| Immigrants | Italy | 82.3 /100 | #129 | Excellent 5.3% |
| Immigrants | Austria | 82.1 /100 | #130 | Excellent 5.3% |
| Immigrants | Israel | 81.9 /100 | #131 | Excellent 5.3% |
| Immigrants | Ethiopia | 81.4 /100 | #132 | Excellent 5.3% |
| Ethiopians | 80.7 /100 | #133 | Excellent 5.3% |
| Slovaks | 80.5 /100 | #134 | Excellent 5.3% |
| New Zealanders | 79.9 /100 | #135 | Good 5.3% |
| Immigrants | Jordan | 79.5 /100 | #136 | Good 5.3% |
| Jordanians | 78.8 /100 | #137 | Good 5.3% |
| Argentineans | 78.8 /100 | #138 | Good 5.3% |