Filipino vs Immigrants from Jamaica Unemployment Among Women with Children Under 18 years
COMPARE
Filipino
Immigrants from Jamaica
Unemployment Among Women with Children Under 18 years
Unemployment Among Women with Children Under 18 years Comparison
Filipinos
Immigrants from Jamaica
4.8%
UNEMPLOYMENT AMONG WOMEN WITH CHILDREN UNDER 18 YEARS
99.9/ 100
METRIC RATING
11th/ 347
METRIC RANK
6.4%
UNEMPLOYMENT AMONG WOMEN WITH CHILDREN UNDER 18 YEARS
0.0/ 100
METRIC RATING
300th/ 347
METRIC RANK
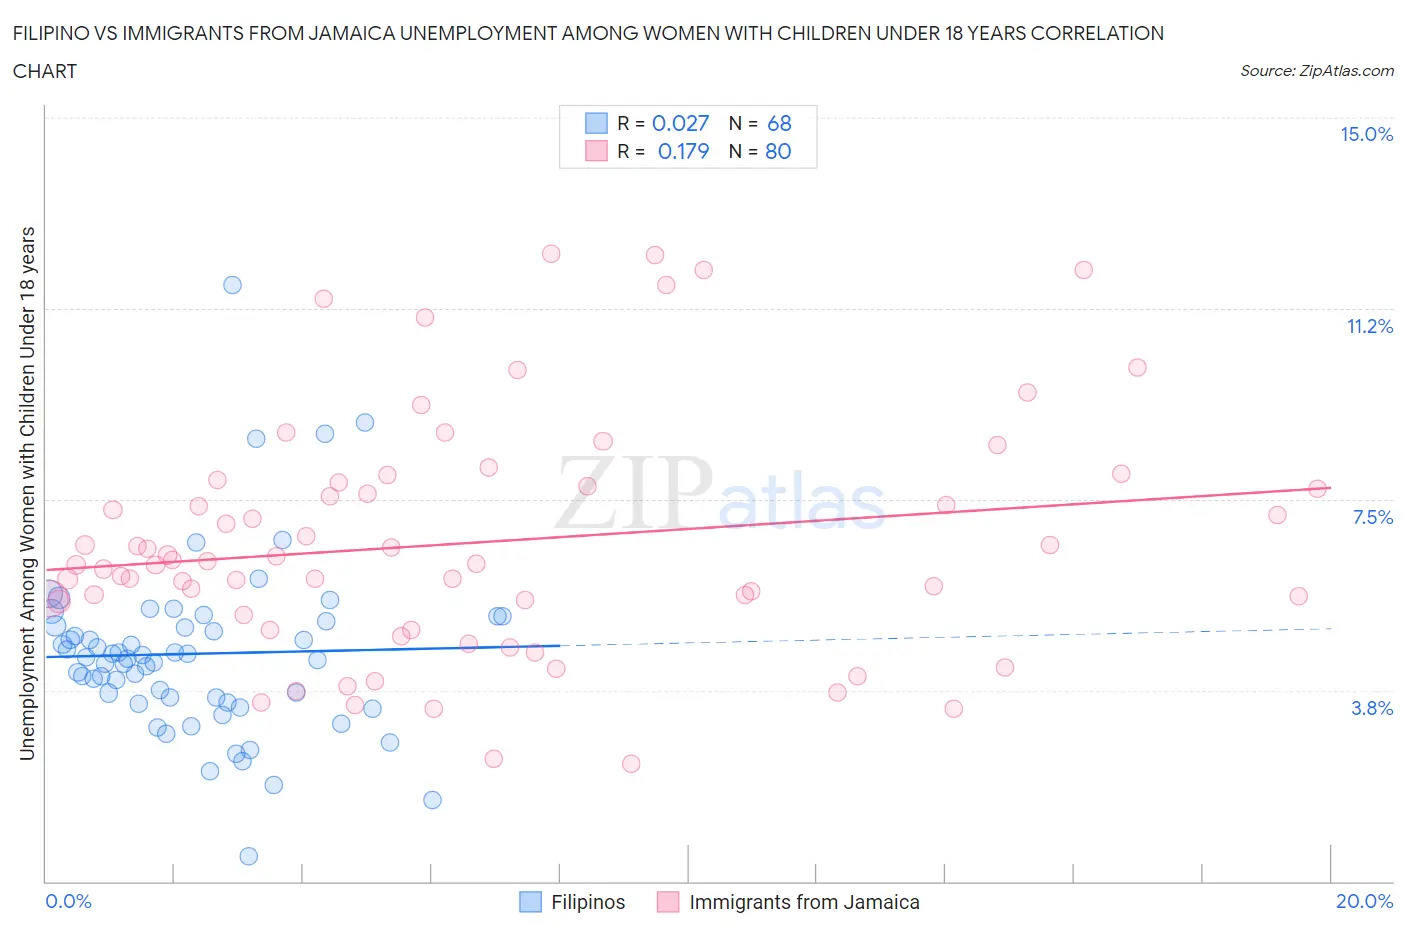
Filipino vs Immigrants from Jamaica Unemployment Among Women with Children Under 18 years Correlation Chart
The statistical analysis conducted on geographies consisting of 248,445,942 people shows no correlation between the proportion of Filipinos and unemployment rate among women with children under the age of 18 in the United States with a correlation coefficient (R) of 0.027 and weighted average of 4.8%. Similarly, the statistical analysis conducted on geographies consisting of 293,535,610 people shows a poor positive correlation between the proportion of Immigrants from Jamaica and unemployment rate among women with children under the age of 18 in the United States with a correlation coefficient (R) of 0.179 and weighted average of 6.4%, a difference of 35.4%.
Unemployment Among Women with Children Under 18 years Correlation Summary
| Measurement | Filipino | Immigrants from Jamaica |
| Minimum | 0.50% | 2.3% |
| Maximum | 11.7% | 12.3% |
| Range | 11.2% | 10.0% |
| Mean | 4.5% | 6.7% |
| Median | 4.4% | 6.3% |
| Interquartile 25% (IQ1) | 3.5% | 5.4% |
| Interquartile 75% (IQ3) | 5.1% | 7.8% |
| Interquartile Range (IQR) | 1.5% | 2.4% |
| Standard Deviation (Sample) | 1.7% | 2.3% |
| Standard Deviation (Population) | 1.7% | 2.3% |
Similar Demographics by Unemployment Among Women with Children Under 18 years
Demographics Similar to Filipinos by Unemployment Among Women with Children Under 18 years
In terms of unemployment among women with children under 18 years, the demographic groups most similar to Filipinos are Czech (4.7%, a difference of 0.45%), Okinawan (4.7%, a difference of 0.46%), Scandinavian (4.8%, a difference of 0.46%), Bulgarian (4.8%, a difference of 0.97%), and Immigrants from Hong Kong (4.7%, a difference of 1.3%).
| Demographics | Rating | Rank | Unemployment Among Women with Children Under 18 years |
| Swedes | 100.0 /100 | #4 | Exceptional 4.7% |
| Tongans | 100.0 /100 | #5 | Exceptional 4.7% |
| Immigrants | Taiwan | 100.0 /100 | #6 | Exceptional 4.7% |
| Immigrants | India | 100.0 /100 | #7 | Exceptional 4.7% |
| Immigrants | Hong Kong | 100.0 /100 | #8 | Exceptional 4.7% |
| Okinawans | 99.9 /100 | #9 | Exceptional 4.7% |
| Czechs | 99.9 /100 | #10 | Exceptional 4.7% |
| Filipinos | 99.9 /100 | #11 | Exceptional 4.8% |
| Scandinavians | 99.9 /100 | #12 | Exceptional 4.8% |
| Bulgarians | 99.9 /100 | #13 | Exceptional 4.8% |
| Cambodians | 99.9 /100 | #14 | Exceptional 4.8% |
| Thais | 99.8 /100 | #15 | Exceptional 4.8% |
| Taiwanese | 99.8 /100 | #16 | Exceptional 4.8% |
| Immigrants | Singapore | 99.8 /100 | #17 | Exceptional 4.9% |
| Slovenes | 99.8 /100 | #18 | Exceptional 4.9% |
Demographics Similar to Immigrants from Jamaica by Unemployment Among Women with Children Under 18 years
In terms of unemployment among women with children under 18 years, the demographic groups most similar to Immigrants from Jamaica are Immigrants from Haiti (6.4%, a difference of 0.050%), Jamaican (6.4%, a difference of 0.14%), Immigrants from Armenia (6.5%, a difference of 0.30%), Immigrants from Latin America (6.4%, a difference of 0.43%), and Immigrants from Honduras (6.5%, a difference of 0.54%).
| Demographics | Rating | Rank | Unemployment Among Women with Children Under 18 years |
| Immigrants | Bangladesh | 0.0 /100 | #293 | Tragic 6.4% |
| Hondurans | 0.0 /100 | #294 | Tragic 6.4% |
| Barbadians | 0.0 /100 | #295 | Tragic 6.4% |
| Haitians | 0.0 /100 | #296 | Tragic 6.4% |
| Immigrants | Senegal | 0.0 /100 | #297 | Tragic 6.4% |
| Immigrants | Latin America | 0.0 /100 | #298 | Tragic 6.4% |
| Jamaicans | 0.0 /100 | #299 | Tragic 6.4% |
| Immigrants | Jamaica | 0.0 /100 | #300 | Tragic 6.4% |
| Immigrants | Haiti | 0.0 /100 | #301 | Tragic 6.4% |
| Immigrants | Armenia | 0.0 /100 | #302 | Tragic 6.5% |
| Immigrants | Honduras | 0.0 /100 | #303 | Tragic 6.5% |
| Vietnamese | 0.0 /100 | #304 | Tragic 6.5% |
| Immigrants | Central America | 0.0 /100 | #305 | Tragic 6.5% |
| Immigrants | Guyana | 0.0 /100 | #306 | Tragic 6.5% |
| Belizeans | 0.0 /100 | #307 | Tragic 6.5% |