Filipino vs Immigrants from Northern Africa Unemployment Among Ages 60 to 64 years
COMPARE
Filipino
Immigrants from Northern Africa
Unemployment Among Ages 60 to 64 years
Unemployment Among Ages 60 to 64 years Comparison
Filipinos
Immigrants from Northern Africa
4.8%
UNEMPLOYMENT AMONG AGES 60 TO 64 YEARS
72.1/ 100
METRIC RATING
155th/ 347
METRIC RANK
4.7%
UNEMPLOYMENT AMONG AGES 60 TO 64 YEARS
98.7/ 100
METRIC RATING
89th/ 347
METRIC RANK
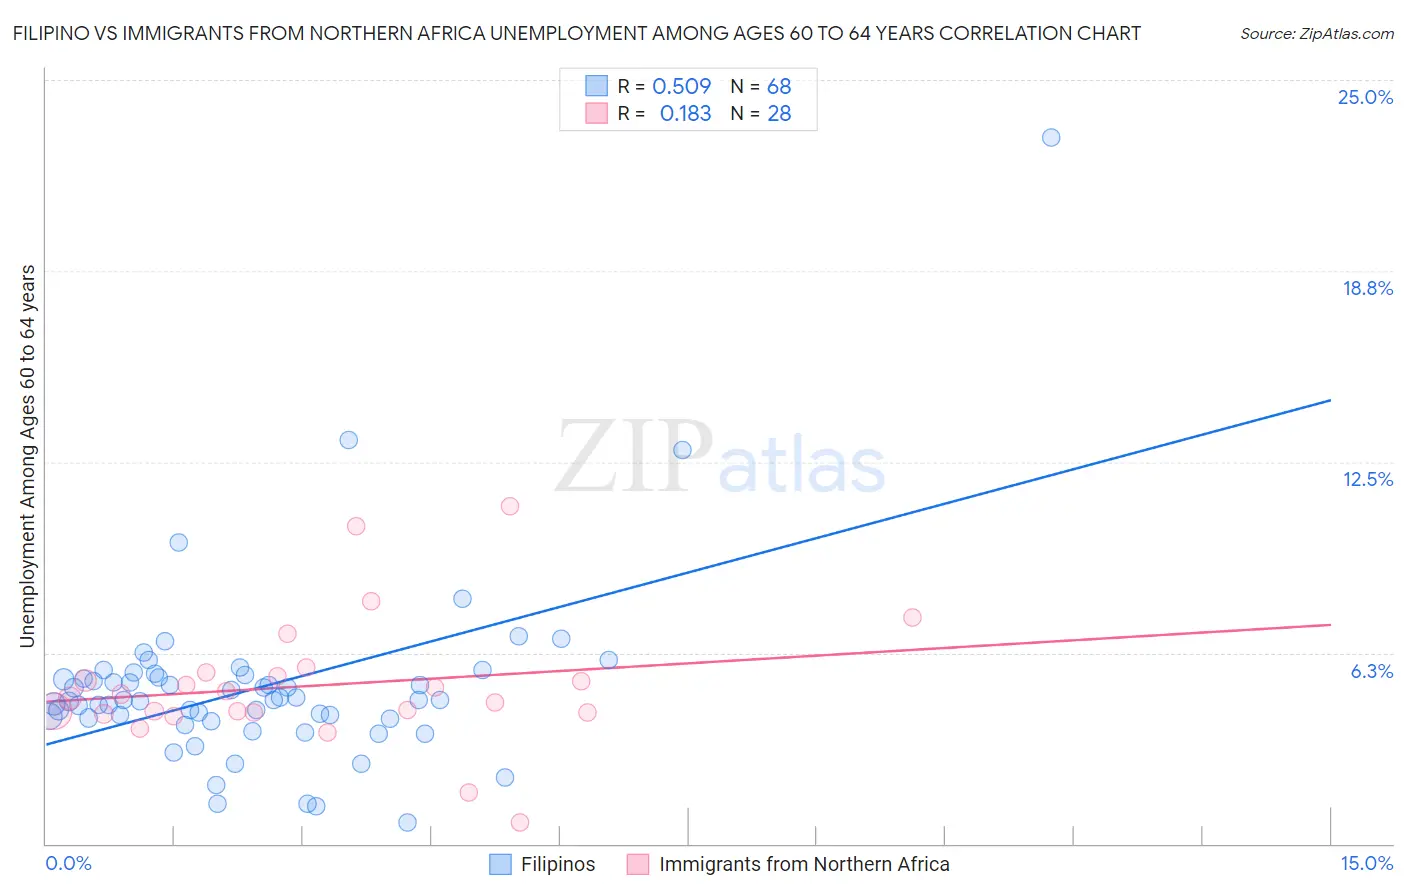
Filipino vs Immigrants from Northern Africa Unemployment Among Ages 60 to 64 years Correlation Chart
The statistical analysis conducted on geographies consisting of 239,029,407 people shows a substantial positive correlation between the proportion of Filipinos and unemployment rate among population between the ages 60 and 64 in the United States with a correlation coefficient (R) of 0.509 and weighted average of 4.8%. Similarly, the statistical analysis conducted on geographies consisting of 300,447,465 people shows a poor positive correlation between the proportion of Immigrants from Northern Africa and unemployment rate among population between the ages 60 and 64 in the United States with a correlation coefficient (R) of 0.183 and weighted average of 4.7%, a difference of 3.1%.
Unemployment Among Ages 60 to 64 years Correlation Summary
| Measurement | Filipino | Immigrants from Northern Africa |
| Minimum | 0.70% | 0.70% |
| Maximum | 23.1% | 11.0% |
| Range | 22.4% | 10.3% |
| Mean | 5.1% | 5.2% |
| Median | 4.7% | 4.8% |
| Interquartile 25% (IQ1) | 4.1% | 4.3% |
| Interquartile 75% (IQ3) | 5.5% | 5.5% |
| Interquartile Range (IQR) | 1.4% | 1.3% |
| Standard Deviation (Sample) | 3.0% | 2.1% |
| Standard Deviation (Population) | 3.0% | 2.1% |
Similar Demographics by Unemployment Among Ages 60 to 64 years
Demographics Similar to Filipinos by Unemployment Among Ages 60 to 64 years
In terms of unemployment among ages 60 to 64 years, the demographic groups most similar to Filipinos are Chilean (4.8%, a difference of 0.020%), Immigrants from Bolivia (4.8%, a difference of 0.13%), Bolivian (4.8%, a difference of 0.16%), American (4.8%, a difference of 0.17%), and Laotian (4.8%, a difference of 0.22%).
| Demographics | Rating | Rank | Unemployment Among Ages 60 to 64 years |
| Latvians | 79.1 /100 | #148 | Good 4.8% |
| Arabs | 78.8 /100 | #149 | Good 4.8% |
| Immigrants | Italy | 78.7 /100 | #150 | Good 4.8% |
| Immigrants | South Africa | 78.5 /100 | #151 | Good 4.8% |
| Americans | 75.7 /100 | #152 | Good 4.8% |
| Bolivians | 75.5 /100 | #153 | Good 4.8% |
| Chileans | 72.6 /100 | #154 | Good 4.8% |
| Filipinos | 72.1 /100 | #155 | Good 4.8% |
| Immigrants | Bolivia | 69.2 /100 | #156 | Good 4.8% |
| Laotians | 66.8 /100 | #157 | Good 4.8% |
| Immigrants | Taiwan | 66.0 /100 | #158 | Good 4.8% |
| Spanish | 65.5 /100 | #159 | Good 4.8% |
| Australians | 65.3 /100 | #160 | Good 4.8% |
| Immigrants | Norway | 65.1 /100 | #161 | Good 4.8% |
| South Africans | 65.1 /100 | #162 | Good 4.8% |
Demographics Similar to Immigrants from Northern Africa by Unemployment Among Ages 60 to 64 years
In terms of unemployment among ages 60 to 64 years, the demographic groups most similar to Immigrants from Northern Africa are Immigrants from Bulgaria (4.7%, a difference of 0.0%), Immigrants from Liberia (4.7%, a difference of 0.050%), Immigrants from Jordan (4.7%, a difference of 0.070%), Immigrants from Oceania (4.7%, a difference of 0.11%), and Thai (4.7%, a difference of 0.13%).
| Demographics | Rating | Rank | Unemployment Among Ages 60 to 64 years |
| Okinawans | 99.1 /100 | #82 | Exceptional 4.7% |
| Immigrants | Egypt | 99.1 /100 | #83 | Exceptional 4.7% |
| Thais | 98.9 /100 | #84 | Exceptional 4.7% |
| Immigrants | Sri Lanka | 98.9 /100 | #85 | Exceptional 4.7% |
| Immigrants | Oceania | 98.9 /100 | #86 | Exceptional 4.7% |
| Immigrants | Jordan | 98.8 /100 | #87 | Exceptional 4.7% |
| Immigrants | Bulgaria | 98.7 /100 | #88 | Exceptional 4.7% |
| Immigrants | Northern Africa | 98.7 /100 | #89 | Exceptional 4.7% |
| Immigrants | Liberia | 98.7 /100 | #90 | Exceptional 4.7% |
| Immigrants | Uganda | 98.4 /100 | #91 | Exceptional 4.7% |
| Romanians | 98.4 /100 | #92 | Exceptional 4.7% |
| Immigrants | Saudi Arabia | 98.3 /100 | #93 | Exceptional 4.7% |
| Immigrants | Kuwait | 98.3 /100 | #94 | Exceptional 4.7% |
| Serbians | 98.2 /100 | #95 | Exceptional 4.7% |
| Poles | 98.1 /100 | #96 | Exceptional 4.7% |