Immigrants from Eastern Africa vs Immigrants from Europe Unemployment Among Seniors over 75 years
COMPARE
Immigrants from Eastern Africa
Immigrants from Europe
Unemployment Among Seniors over 75 years
Unemployment Among Seniors over 75 years Comparison
Immigrants from Eastern Africa
Immigrants from Europe
8.7%
UNEMPLOYMENT AMONG SENIORS OVER 75 YEARS
57.6/ 100
METRIC RATING
167th/ 347
METRIC RANK
8.8%
UNEMPLOYMENT AMONG SENIORS OVER 75 YEARS
35.2/ 100
METRIC RATING
187th/ 347
METRIC RANK
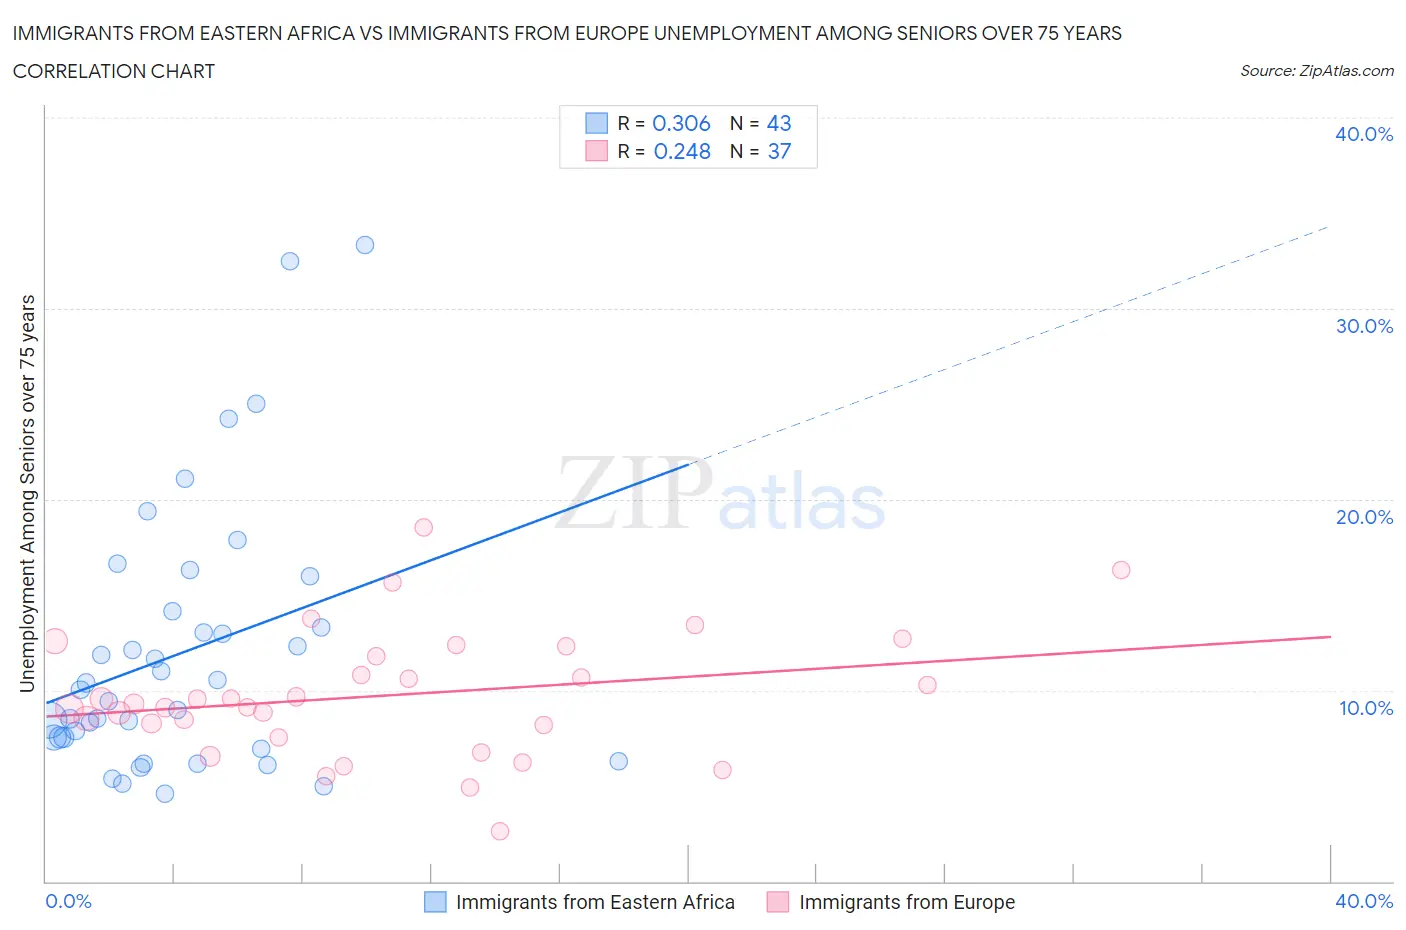
Immigrants from Eastern Africa vs Immigrants from Europe Unemployment Among Seniors over 75 years Correlation Chart
The statistical analysis conducted on geographies consisting of 189,663,738 people shows a mild positive correlation between the proportion of Immigrants from Eastern Africa and unemployment rate among seniors over the age of 75 in the United States with a correlation coefficient (R) of 0.306 and weighted average of 8.7%. Similarly, the statistical analysis conducted on geographies consisting of 233,232,090 people shows a weak positive correlation between the proportion of Immigrants from Europe and unemployment rate among seniors over the age of 75 in the United States with a correlation coefficient (R) of 0.248 and weighted average of 8.8%, a difference of 1.2%.
Unemployment Among Seniors over 75 years Correlation Summary
| Measurement | Immigrants from Eastern Africa | Immigrants from Europe |
| Minimum | 4.6% | 2.6% |
| Maximum | 33.3% | 18.5% |
| Range | 28.7% | 15.9% |
| Mean | 12.0% | 9.7% |
| Median | 10.0% | 9.3% |
| Interquartile 25% (IQ1) | 7.5% | 7.9% |
| Interquartile 75% (IQ3) | 14.1% | 12.1% |
| Interquartile Range (IQR) | 6.6% | 4.2% |
| Standard Deviation (Sample) | 6.9% | 3.3% |
| Standard Deviation (Population) | 6.8% | 3.3% |
Demographics Similar to Immigrants from Eastern Africa and Immigrants from Europe by Unemployment Among Seniors over 75 years
In terms of unemployment among seniors over 75 years, the demographic groups most similar to Immigrants from Eastern Africa are Immigrants from Lithuania (8.7%, a difference of 0.020%), Fijian (8.7%, a difference of 0.060%), Zimbabwean (8.7%, a difference of 0.19%), Dominican (8.7%, a difference of 0.31%), and Immigrants (8.7%, a difference of 0.32%). Similarly, the demographic groups most similar to Immigrants from Europe are Immigrants from Ethiopia (8.8%, a difference of 0.050%), Immigrants from Micronesia (8.8%, a difference of 0.11%), Choctaw (8.8%, a difference of 0.11%), Immigrants from Afghanistan (8.8%, a difference of 0.17%), and Guatemalan (8.8%, a difference of 0.24%).
| Demographics | Rating | Rank | Unemployment Among Seniors over 75 years |
| Immigrants | Eastern Africa | 57.6 /100 | #167 | Average 8.7% |
| Immigrants | Lithuania | 57.2 /100 | #168 | Average 8.7% |
| Fijians | 56.4 /100 | #169 | Average 8.7% |
| Zimbabweans | 54.1 /100 | #170 | Average 8.7% |
| Dominicans | 51.9 /100 | #171 | Average 8.7% |
| Immigrants | Immigrants | 51.8 /100 | #172 | Average 8.7% |
| Australians | 50.3 /100 | #173 | Average 8.7% |
| Immigrants | El Salvador | 49.7 /100 | #174 | Average 8.7% |
| Syrians | 49.6 /100 | #175 | Average 8.7% |
| Somalis | 45.3 /100 | #176 | Average 8.8% |
| Central Americans | 43.3 /100 | #177 | Average 8.8% |
| West Indians | 41.9 /100 | #178 | Average 8.8% |
| Immigrants | Italy | 41.7 /100 | #179 | Average 8.8% |
| Immigrants | Somalia | 41.7 /100 | #180 | Average 8.8% |
| Immigrants | Thailand | 40.2 /100 | #181 | Average 8.8% |
| Guatemalans | 39.5 /100 | #182 | Fair 8.8% |
| Immigrants | Afghanistan | 38.2 /100 | #183 | Fair 8.8% |
| Immigrants | Micronesia | 37.2 /100 | #184 | Fair 8.8% |
| Choctaw | 37.1 /100 | #185 | Fair 8.8% |
| Immigrants | Ethiopia | 36.2 /100 | #186 | Fair 8.8% |
| Immigrants | Europe | 35.2 /100 | #187 | Fair 8.8% |