Egyptian vs Taiwanese Unemployment Among Ages 30 to 34 years
COMPARE
Egyptian
Taiwanese
Unemployment Among Ages 30 to 34 years
Unemployment Among Ages 30 to 34 years Comparison
Egyptians
Taiwanese
5.3%
UNEMPLOYMENT AMONG AGES 30 TO 34 YEARS
86.4/ 100
METRIC RATING
110th/ 347
METRIC RANK
5.3%
UNEMPLOYMENT AMONG AGES 30 TO 34 YEARS
79.4/ 100
METRIC RATING
127th/ 347
METRIC RANK
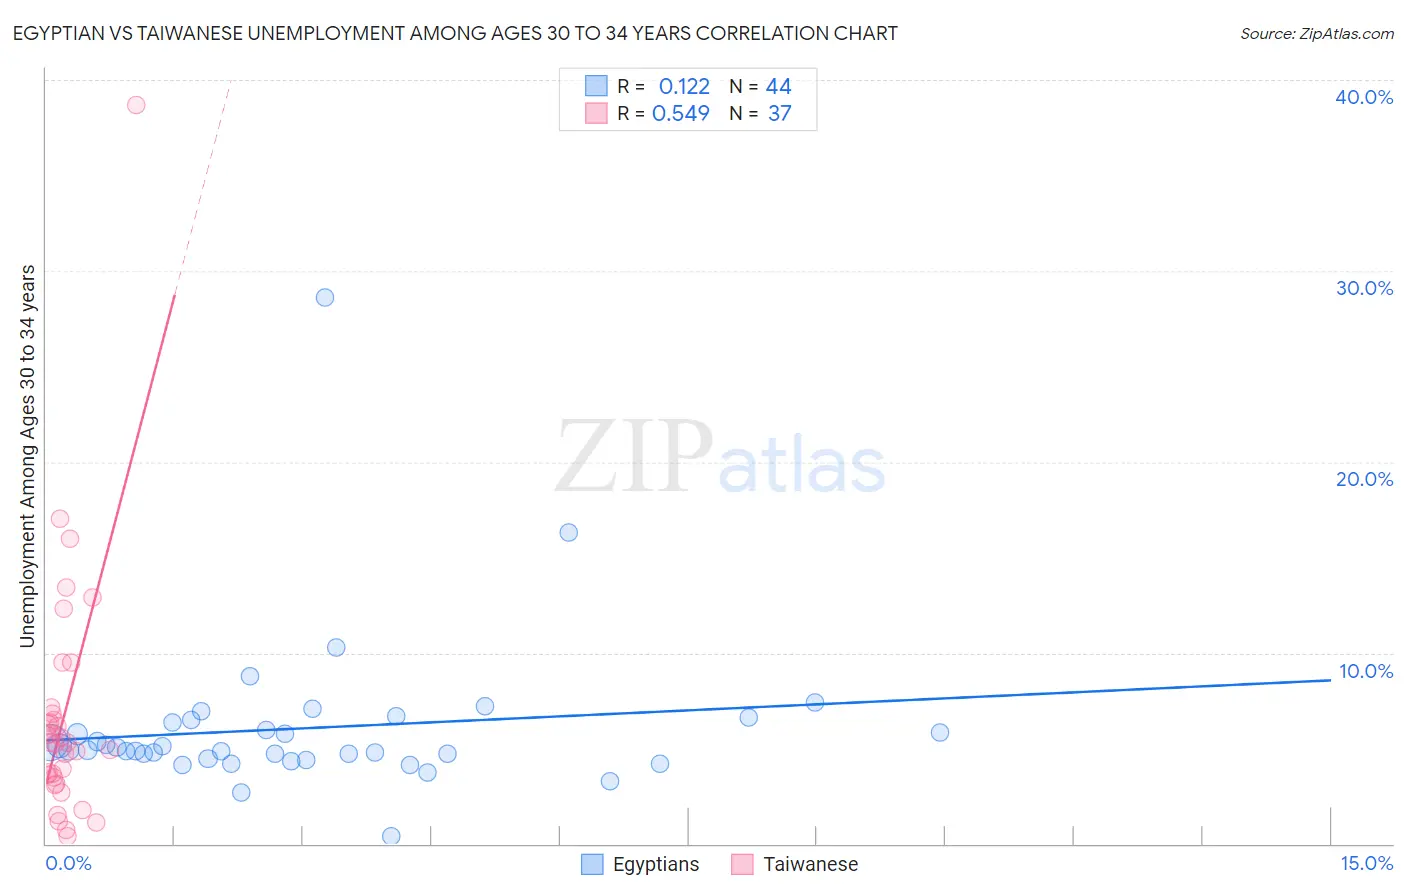
Egyptian vs Taiwanese Unemployment Among Ages 30 to 34 years Correlation Chart
The statistical analysis conducted on geographies consisting of 267,282,387 people shows a poor positive correlation between the proportion of Egyptians and unemployment rate among population between the ages 30 and 34 in the United States with a correlation coefficient (R) of 0.122 and weighted average of 5.3%. Similarly, the statistical analysis conducted on geographies consisting of 31,645,332 people shows a substantial positive correlation between the proportion of Taiwanese and unemployment rate among population between the ages 30 and 34 in the United States with a correlation coefficient (R) of 0.549 and weighted average of 5.3%, a difference of 0.89%.
Unemployment Among Ages 30 to 34 years Correlation Summary
| Measurement | Egyptian | Taiwanese |
| Minimum | 0.40% | 0.40% |
| Maximum | 28.6% | 38.7% |
| Range | 28.2% | 38.3% |
| Mean | 6.0% | 6.8% |
| Median | 5.0% | 5.3% |
| Interquartile 25% (IQ1) | 4.6% | 3.3% |
| Interquartile 75% (IQ3) | 6.4% | 7.0% |
| Interquartile Range (IQR) | 1.8% | 3.7% |
| Standard Deviation (Sample) | 4.2% | 6.8% |
| Standard Deviation (Population) | 4.1% | 6.7% |
Demographics Similar to Egyptians and Taiwanese by Unemployment Among Ages 30 to 34 years
In terms of unemployment among ages 30 to 34 years, the demographic groups most similar to Egyptians are Immigrants from Pakistan (5.3%, a difference of 0.020%), Immigrants from Chile (5.3%, a difference of 0.050%), Swiss (5.3%, a difference of 0.060%), Immigrants from Middle Africa (5.3%, a difference of 0.12%), and Immigrants from Spain (5.3%, a difference of 0.12%). Similarly, the demographic groups most similar to Taiwanese are Immigrants from Uruguay (5.3%, a difference of 0.020%), Immigrants from Sri Lanka (5.3%, a difference of 0.080%), Greek (5.3%, a difference of 0.11%), Immigrants from Brazil (5.3%, a difference of 0.16%), and Immigrants from Italy (5.3%, a difference of 0.19%).
| Demographics | Rating | Rank | Unemployment Among Ages 30 to 34 years |
| Immigrants | Middle Africa | 87.1 /100 | #108 | Excellent 5.3% |
| Immigrants | Chile | 86.7 /100 | #109 | Excellent 5.3% |
| Egyptians | 86.4 /100 | #110 | Excellent 5.3% |
| Immigrants | Pakistan | 86.2 /100 | #111 | Excellent 5.3% |
| Swiss | 85.9 /100 | #112 | Excellent 5.3% |
| Immigrants | Spain | 85.6 /100 | #113 | Excellent 5.3% |
| Estonians | 83.7 /100 | #114 | Excellent 5.3% |
| Immigrants | Albania | 83.4 /100 | #115 | Excellent 5.3% |
| Eastern Europeans | 83.2 /100 | #116 | Excellent 5.3% |
| Australians | 83.1 /100 | #117 | Excellent 5.3% |
| Immigrants | South Africa | 83.0 /100 | #118 | Excellent 5.3% |
| New Zealanders | 82.5 /100 | #119 | Excellent 5.3% |
| Immigrants | Poland | 82.4 /100 | #120 | Excellent 5.3% |
| Romanians | 82.3 /100 | #121 | Excellent 5.3% |
| Immigrants | Netherlands | 81.8 /100 | #122 | Excellent 5.3% |
| Immigrants | Italy | 81.1 /100 | #123 | Excellent 5.3% |
| Immigrants | Brazil | 80.8 /100 | #124 | Excellent 5.3% |
| Greeks | 80.4 /100 | #125 | Excellent 5.3% |
| Immigrants | Sri Lanka | 80.2 /100 | #126 | Excellent 5.3% |
| Taiwanese | 79.4 /100 | #127 | Good 5.3% |
| Immigrants | Uruguay | 79.3 /100 | #128 | Good 5.3% |