Ecuadorian vs Korean Unemployment Among Ages 25 to 29 years
COMPARE
Ecuadorian
Korean
Unemployment Among Ages 25 to 29 years
Unemployment Among Ages 25 to 29 years Comparison
Ecuadorians
Koreans
7.4%
UNEMPLOYMENT AMONG AGES 25 TO 29 YEARS
0.1/ 100
METRIC RATING
262nd/ 347
METRIC RANK
6.7%
UNEMPLOYMENT AMONG AGES 25 TO 29 YEARS
29.3/ 100
METRIC RATING
190th/ 347
METRIC RANK
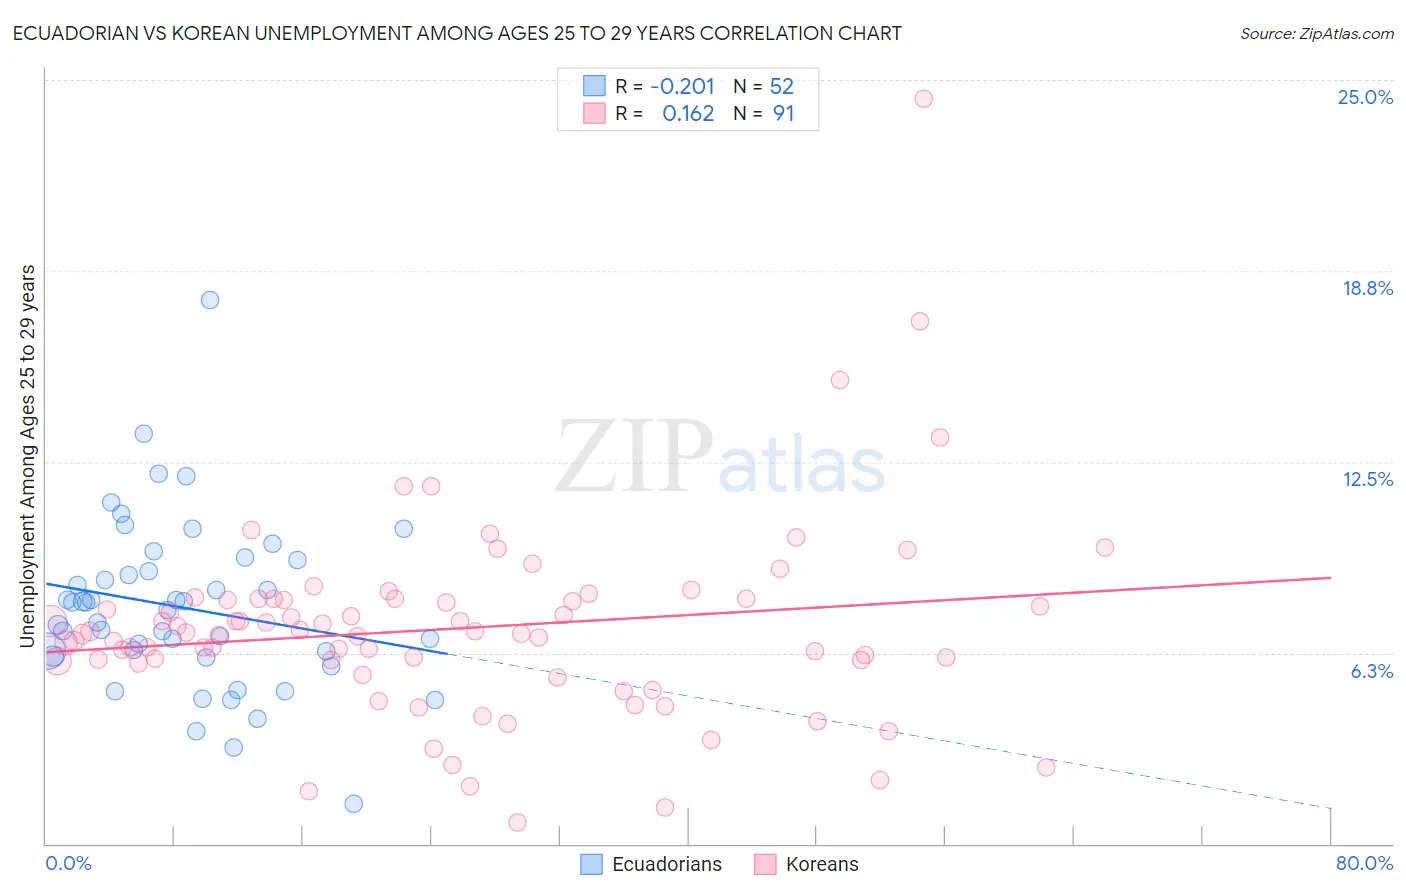
Ecuadorian vs Korean Unemployment Among Ages 25 to 29 years Correlation Chart
The statistical analysis conducted on geographies consisting of 307,503,017 people shows a weak negative correlation between the proportion of Ecuadorians and unemployment rate among population between the ages 25 and 29 in the United States with a correlation coefficient (R) of -0.201 and weighted average of 7.4%. Similarly, the statistical analysis conducted on geographies consisting of 473,026,507 people shows a poor positive correlation between the proportion of Koreans and unemployment rate among population between the ages 25 and 29 in the United States with a correlation coefficient (R) of 0.162 and weighted average of 6.7%, a difference of 9.5%.
Unemployment Among Ages 25 to 29 years Correlation Summary
| Measurement | Ecuadorian | Korean |
| Minimum | 1.3% | 0.70% |
| Maximum | 17.8% | 24.4% |
| Range | 16.5% | 23.7% |
| Mean | 7.7% | 7.0% |
| Median | 7.8% | 6.9% |
| Interquartile 25% (IQ1) | 6.2% | 6.0% |
| Interquartile 75% (IQ3) | 9.1% | 8.0% |
| Interquartile Range (IQR) | 2.9% | 2.0% |
| Standard Deviation (Sample) | 2.8% | 3.2% |
| Standard Deviation (Population) | 2.8% | 3.2% |
Similar Demographics by Unemployment Among Ages 25 to 29 years
Demographics Similar to Ecuadorians by Unemployment Among Ages 25 to 29 years
In terms of unemployment among ages 25 to 29 years, the demographic groups most similar to Ecuadorians are Nigerian (7.4%, a difference of 0.050%), Kiowa (7.4%, a difference of 0.080%), American (7.4%, a difference of 0.14%), Immigrants from Western Africa (7.4%, a difference of 0.17%), and Immigrants from Fiji (7.4%, a difference of 0.23%).
| Demographics | Rating | Rank | Unemployment Among Ages 25 to 29 years |
| Immigrants | Cameroon | 0.3 /100 | #255 | Tragic 7.2% |
| Mexican American Indians | 0.3 /100 | #256 | Tragic 7.3% |
| Assyrians/Chaldeans/Syriacs | 0.2 /100 | #257 | Tragic 7.3% |
| Ottawa | 0.1 /100 | #258 | Tragic 7.3% |
| Cree | 0.1 /100 | #259 | Tragic 7.3% |
| Americans | 0.1 /100 | #260 | Tragic 7.4% |
| Nigerians | 0.1 /100 | #261 | Tragic 7.4% |
| Ecuadorians | 0.1 /100 | #262 | Tragic 7.4% |
| Kiowa | 0.1 /100 | #263 | Tragic 7.4% |
| Immigrants | Western Africa | 0.1 /100 | #264 | Tragic 7.4% |
| Immigrants | Fiji | 0.1 /100 | #265 | Tragic 7.4% |
| Paiute | 0.1 /100 | #266 | Tragic 7.4% |
| Pennsylvania Germans | 0.1 /100 | #267 | Tragic 7.4% |
| Immigrants | Ecuador | 0.1 /100 | #268 | Tragic 7.4% |
| Immigrants | Latin America | 0.1 /100 | #269 | Tragic 7.4% |
Demographics Similar to Koreans by Unemployment Among Ages 25 to 29 years
In terms of unemployment among ages 25 to 29 years, the demographic groups most similar to Koreans are Chickasaw (6.7%, a difference of 0.040%), Immigrants from Ukraine (6.7%, a difference of 0.050%), Alsatian (6.7%, a difference of 0.090%), Immigrants from Greece (6.7%, a difference of 0.090%), and Immigrants from Western Asia (6.7%, a difference of 0.15%).
| Demographics | Rating | Rank | Unemployment Among Ages 25 to 29 years |
| Immigrants | Scotland | 39.6 /100 | #183 | Fair 6.7% |
| Immigrants | Costa Rica | 38.3 /100 | #184 | Fair 6.7% |
| Moroccans | 35.9 /100 | #185 | Fair 6.7% |
| Immigrants | Iran | 34.4 /100 | #186 | Fair 6.7% |
| Immigrants | South America | 33.0 /100 | #187 | Fair 6.7% |
| Irish | 32.8 /100 | #188 | Fair 6.7% |
| Argentineans | 32.1 /100 | #189 | Fair 6.7% |
| Koreans | 29.3 /100 | #190 | Fair 6.7% |
| Chickasaw | 28.7 /100 | #191 | Fair 6.7% |
| Immigrants | Ukraine | 28.6 /100 | #192 | Fair 6.7% |
| Alsatians | 28.1 /100 | #193 | Fair 6.7% |
| Immigrants | Greece | 28.0 /100 | #194 | Fair 6.7% |
| Immigrants | Western Asia | 27.3 /100 | #195 | Fair 6.7% |
| Hungarians | 26.8 /100 | #196 | Fair 6.8% |
| Italians | 26.5 /100 | #197 | Fair 6.8% |