Immigrants from Central America vs Korean Unemployment Among Ages 25 to 29 years
COMPARE
Immigrants from Central America
Korean
Unemployment Among Ages 25 to 29 years
Unemployment Among Ages 25 to 29 years Comparison
Immigrants from Central America
Koreans
7.5%
UNEMPLOYMENT AMONG AGES 25 TO 29 YEARS
0.0/ 100
METRIC RATING
274th/ 347
METRIC RANK
6.7%
UNEMPLOYMENT AMONG AGES 25 TO 29 YEARS
29.3/ 100
METRIC RATING
190th/ 347
METRIC RANK
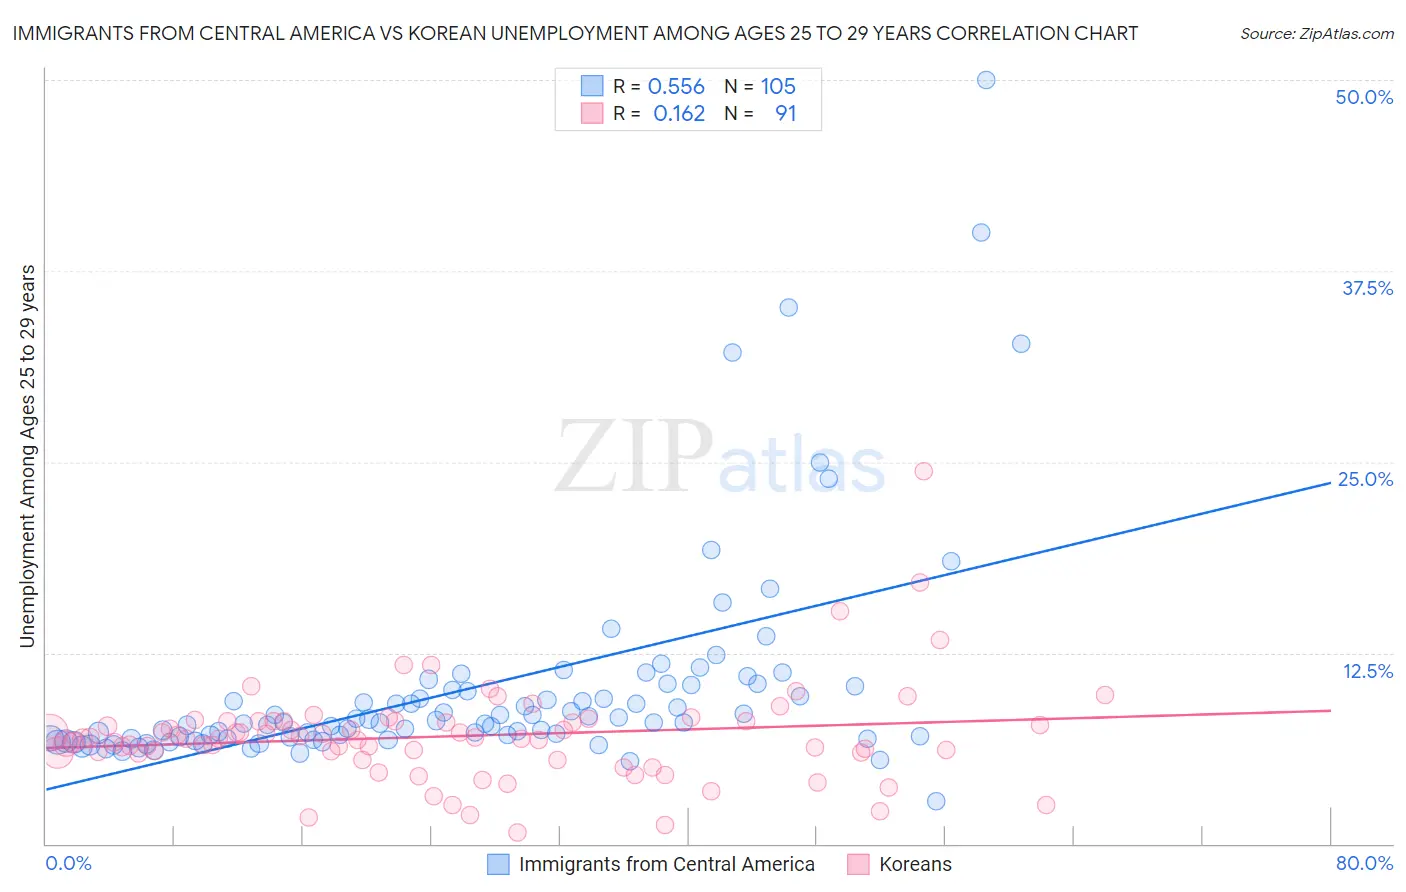
Immigrants from Central America vs Korean Unemployment Among Ages 25 to 29 years Correlation Chart
The statistical analysis conducted on geographies consisting of 488,513,872 people shows a substantial positive correlation between the proportion of Immigrants from Central America and unemployment rate among population between the ages 25 and 29 in the United States with a correlation coefficient (R) of 0.556 and weighted average of 7.5%. Similarly, the statistical analysis conducted on geographies consisting of 473,026,507 people shows a poor positive correlation between the proportion of Koreans and unemployment rate among population between the ages 25 and 29 in the United States with a correlation coefficient (R) of 0.162 and weighted average of 6.7%, a difference of 11.0%.
Unemployment Among Ages 25 to 29 years Correlation Summary
| Measurement | Immigrants from Central America | Korean |
| Minimum | 2.8% | 0.70% |
| Maximum | 50.0% | 24.4% |
| Range | 47.2% | 23.7% |
| Mean | 10.2% | 7.0% |
| Median | 8.0% | 6.9% |
| Interquartile 25% (IQ1) | 6.9% | 6.0% |
| Interquartile 75% (IQ3) | 10.2% | 8.0% |
| Interquartile Range (IQR) | 3.3% | 2.0% |
| Standard Deviation (Sample) | 7.2% | 3.2% |
| Standard Deviation (Population) | 7.2% | 3.2% |
Similar Demographics by Unemployment Among Ages 25 to 29 years
Demographics Similar to Immigrants from Central America by Unemployment Among Ages 25 to 29 years
In terms of unemployment among ages 25 to 29 years, the demographic groups most similar to Immigrants from Central America are Immigrants from Ghana (7.5%, a difference of 0.080%), Immigrants from Nigeria (7.5%, a difference of 0.21%), Immigrants from Bahamas (7.5%, a difference of 0.23%), Choctaw (7.5%, a difference of 0.29%), and Bahamian (7.5%, a difference of 0.31%).
| Demographics | Rating | Rank | Unemployment Among Ages 25 to 29 years |
| Pennsylvania Germans | 0.1 /100 | #267 | Tragic 7.4% |
| Immigrants | Ecuador | 0.1 /100 | #268 | Tragic 7.4% |
| Immigrants | Latin America | 0.1 /100 | #269 | Tragic 7.4% |
| Bahamians | 0.0 /100 | #270 | Tragic 7.5% |
| Choctaw | 0.0 /100 | #271 | Tragic 7.5% |
| Immigrants | Bahamas | 0.0 /100 | #272 | Tragic 7.5% |
| Immigrants | Nigeria | 0.0 /100 | #273 | Tragic 7.5% |
| Immigrants | Central America | 0.0 /100 | #274 | Tragic 7.5% |
| Immigrants | Ghana | 0.0 /100 | #275 | Tragic 7.5% |
| French American Indians | 0.0 /100 | #276 | Tragic 7.5% |
| Iroquois | 0.0 /100 | #277 | Tragic 7.5% |
| Mexicans | 0.0 /100 | #278 | Tragic 7.5% |
| Nepalese | 0.0 /100 | #279 | Tragic 7.5% |
| Immigrants | Caribbean | 0.0 /100 | #280 | Tragic 7.5% |
| Immigrants | Bangladesh | 0.0 /100 | #281 | Tragic 7.5% |
Demographics Similar to Koreans by Unemployment Among Ages 25 to 29 years
In terms of unemployment among ages 25 to 29 years, the demographic groups most similar to Koreans are Chickasaw (6.7%, a difference of 0.040%), Immigrants from Ukraine (6.7%, a difference of 0.050%), Alsatian (6.7%, a difference of 0.090%), Immigrants from Greece (6.7%, a difference of 0.090%), and Immigrants from Western Asia (6.7%, a difference of 0.15%).
| Demographics | Rating | Rank | Unemployment Among Ages 25 to 29 years |
| Immigrants | Scotland | 39.6 /100 | #183 | Fair 6.7% |
| Immigrants | Costa Rica | 38.3 /100 | #184 | Fair 6.7% |
| Moroccans | 35.9 /100 | #185 | Fair 6.7% |
| Immigrants | Iran | 34.4 /100 | #186 | Fair 6.7% |
| Immigrants | South America | 33.0 /100 | #187 | Fair 6.7% |
| Irish | 32.8 /100 | #188 | Fair 6.7% |
| Argentineans | 32.1 /100 | #189 | Fair 6.7% |
| Koreans | 29.3 /100 | #190 | Fair 6.7% |
| Chickasaw | 28.7 /100 | #191 | Fair 6.7% |
| Immigrants | Ukraine | 28.6 /100 | #192 | Fair 6.7% |
| Alsatians | 28.1 /100 | #193 | Fair 6.7% |
| Immigrants | Greece | 28.0 /100 | #194 | Fair 6.7% |
| Immigrants | Western Asia | 27.3 /100 | #195 | Fair 6.7% |
| Hungarians | 26.8 /100 | #196 | Fair 6.8% |
| Italians | 26.5 /100 | #197 | Fair 6.8% |