Ecuadorian vs Immigrants from Taiwan Unemployment Among Women with Children Under 18 years
COMPARE
Ecuadorian
Immigrants from Taiwan
Unemployment Among Women with Children Under 18 years
Unemployment Among Women with Children Under 18 years Comparison
Ecuadorians
Immigrants from Taiwan
6.5%
UNEMPLOYMENT AMONG WOMEN WITH CHILDREN UNDER 18 YEARS
0.0/ 100
METRIC RATING
309th/ 347
METRIC RANK
4.7%
UNEMPLOYMENT AMONG WOMEN WITH CHILDREN UNDER 18 YEARS
100.0/ 100
METRIC RATING
6th/ 347
METRIC RANK
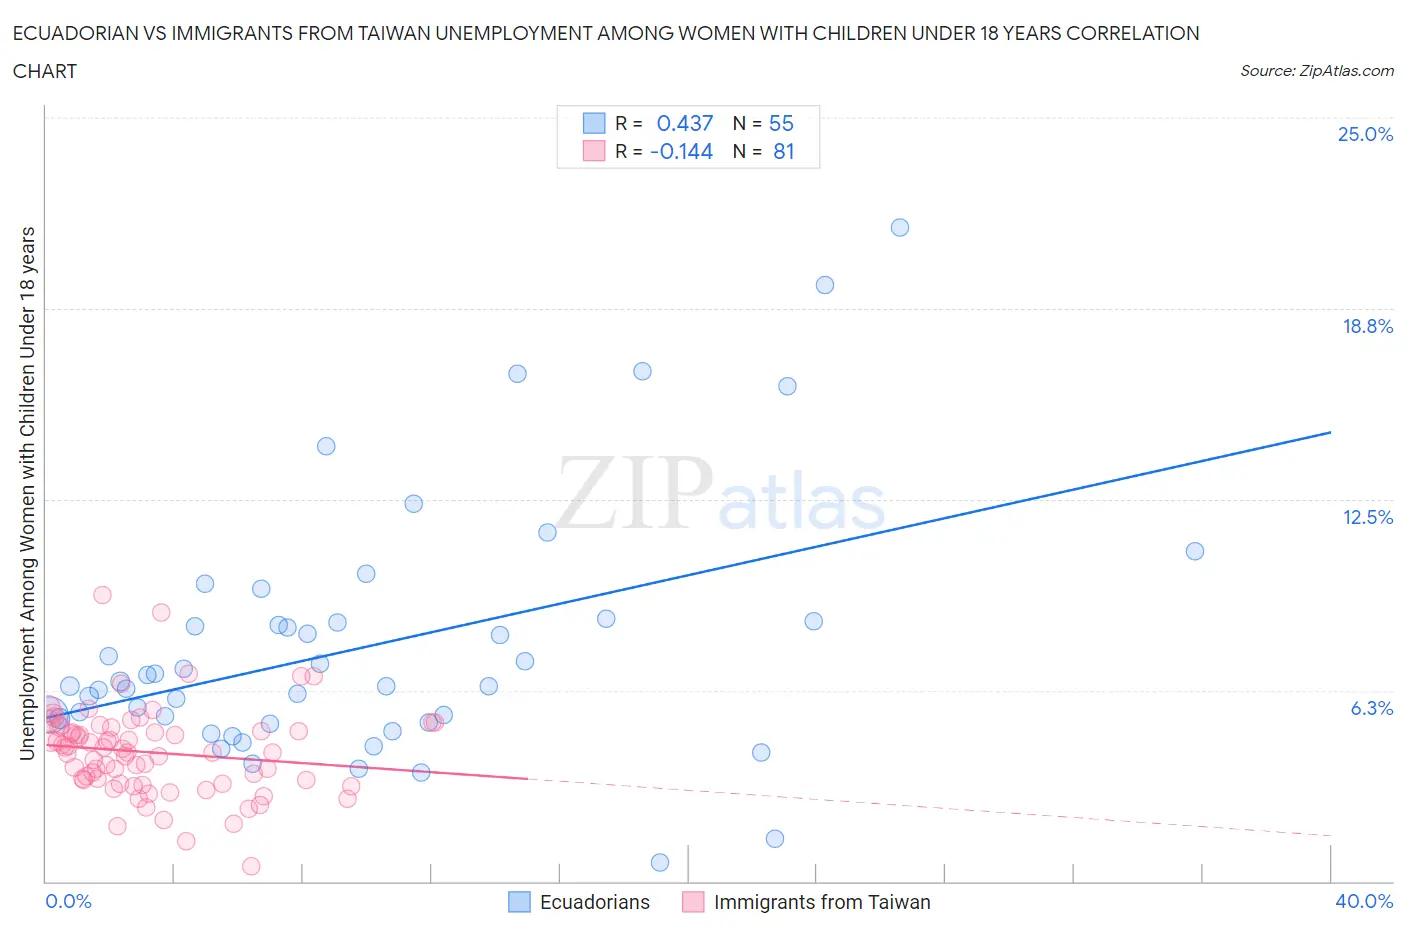
Ecuadorian vs Immigrants from Taiwan Unemployment Among Women with Children Under 18 years Correlation Chart
The statistical analysis conducted on geographies consisting of 309,662,769 people shows a moderate positive correlation between the proportion of Ecuadorians and unemployment rate among women with children under the age of 18 in the United States with a correlation coefficient (R) of 0.437 and weighted average of 6.5%. Similarly, the statistical analysis conducted on geographies consisting of 290,159,768 people shows a poor negative correlation between the proportion of Immigrants from Taiwan and unemployment rate among women with children under the age of 18 in the United States with a correlation coefficient (R) of -0.144 and weighted average of 4.7%, a difference of 40.2%.
Unemployment Among Women with Children Under 18 years Correlation Summary
| Measurement | Ecuadorian | Immigrants from Taiwan |
| Minimum | 0.60% | 0.50% |
| Maximum | 21.4% | 9.3% |
| Range | 20.8% | 8.8% |
| Mean | 7.7% | 4.2% |
| Median | 6.4% | 4.2% |
| Interquartile 25% (IQ1) | 5.2% | 3.2% |
| Interquartile 75% (IQ3) | 8.5% | 5.0% |
| Interquartile Range (IQR) | 3.3% | 1.7% |
| Standard Deviation (Sample) | 4.2% | 1.4% |
| Standard Deviation (Population) | 4.1% | 1.4% |
Similar Demographics by Unemployment Among Women with Children Under 18 years
Demographics Similar to Ecuadorians by Unemployment Among Women with Children Under 18 years
In terms of unemployment among women with children under 18 years, the demographic groups most similar to Ecuadorians are African (6.5%, a difference of 0.090%), Guyanese (6.6%, a difference of 0.24%), Belizean (6.5%, a difference of 0.31%), Immigrants from Guyana (6.5%, a difference of 0.38%), and Immigrants from Central America (6.5%, a difference of 0.43%).
| Demographics | Rating | Rank | Unemployment Among Women with Children Under 18 years |
| Immigrants | Armenia | 0.0 /100 | #302 | Tragic 6.5% |
| Immigrants | Honduras | 0.0 /100 | #303 | Tragic 6.5% |
| Vietnamese | 0.0 /100 | #304 | Tragic 6.5% |
| Immigrants | Central America | 0.0 /100 | #305 | Tragic 6.5% |
| Immigrants | Guyana | 0.0 /100 | #306 | Tragic 6.5% |
| Belizeans | 0.0 /100 | #307 | Tragic 6.5% |
| Africans | 0.0 /100 | #308 | Tragic 6.5% |
| Ecuadorians | 0.0 /100 | #309 | Tragic 6.5% |
| Guyanese | 0.0 /100 | #310 | Tragic 6.6% |
| Yaqui | 0.0 /100 | #311 | Tragic 6.6% |
| Immigrants | Mexico | 0.0 /100 | #312 | Tragic 6.6% |
| Hispanics or Latinos | 0.0 /100 | #313 | Tragic 6.6% |
| British West Indians | 0.0 /100 | #314 | Tragic 6.6% |
| Immigrants | West Indies | 0.0 /100 | #315 | Tragic 6.6% |
| Immigrants | Ecuador | 0.0 /100 | #316 | Tragic 6.6% |
Demographics Similar to Immigrants from Taiwan by Unemployment Among Women with Children Under 18 years
In terms of unemployment among women with children under 18 years, the demographic groups most similar to Immigrants from Taiwan are Tongan (4.7%, a difference of 0.11%), Immigrants from India (4.7%, a difference of 0.11%), Swedish (4.7%, a difference of 0.16%), Immigrants from Hong Kong (4.7%, a difference of 0.53%), and Okinawan (4.7%, a difference of 1.4%).
| Demographics | Rating | Rank | Unemployment Among Women with Children Under 18 years |
| Norwegians | 100.0 /100 | #1 | Exceptional 4.4% |
| Hmong | 100.0 /100 | #2 | Exceptional 4.5% |
| Danes | 100.0 /100 | #3 | Exceptional 4.5% |
| Swedes | 100.0 /100 | #4 | Exceptional 4.7% |
| Tongans | 100.0 /100 | #5 | Exceptional 4.7% |
| Immigrants | Taiwan | 100.0 /100 | #6 | Exceptional 4.7% |
| Immigrants | India | 100.0 /100 | #7 | Exceptional 4.7% |
| Immigrants | Hong Kong | 100.0 /100 | #8 | Exceptional 4.7% |
| Okinawans | 99.9 /100 | #9 | Exceptional 4.7% |
| Czechs | 99.9 /100 | #10 | Exceptional 4.7% |
| Filipinos | 99.9 /100 | #11 | Exceptional 4.8% |
| Scandinavians | 99.9 /100 | #12 | Exceptional 4.8% |
| Bulgarians | 99.9 /100 | #13 | Exceptional 4.8% |
| Cambodians | 99.9 /100 | #14 | Exceptional 4.8% |
| Thais | 99.8 /100 | #15 | Exceptional 4.8% |