Ecuadorian vs Immigrants from Taiwan Average Family Size
COMPARE
Ecuadorian
Immigrants from Taiwan
Average Family Size
Average Family Size Comparison
Ecuadorians
Immigrants from Taiwan
3.32
AVERAGE FAMILY SIZE
99.8/ 100
METRIC RATING
82nd/ 347
METRIC RANK
3.24
AVERAGE FAMILY SIZE
68.1/ 100
METRIC RATING
156th/ 347
METRIC RANK
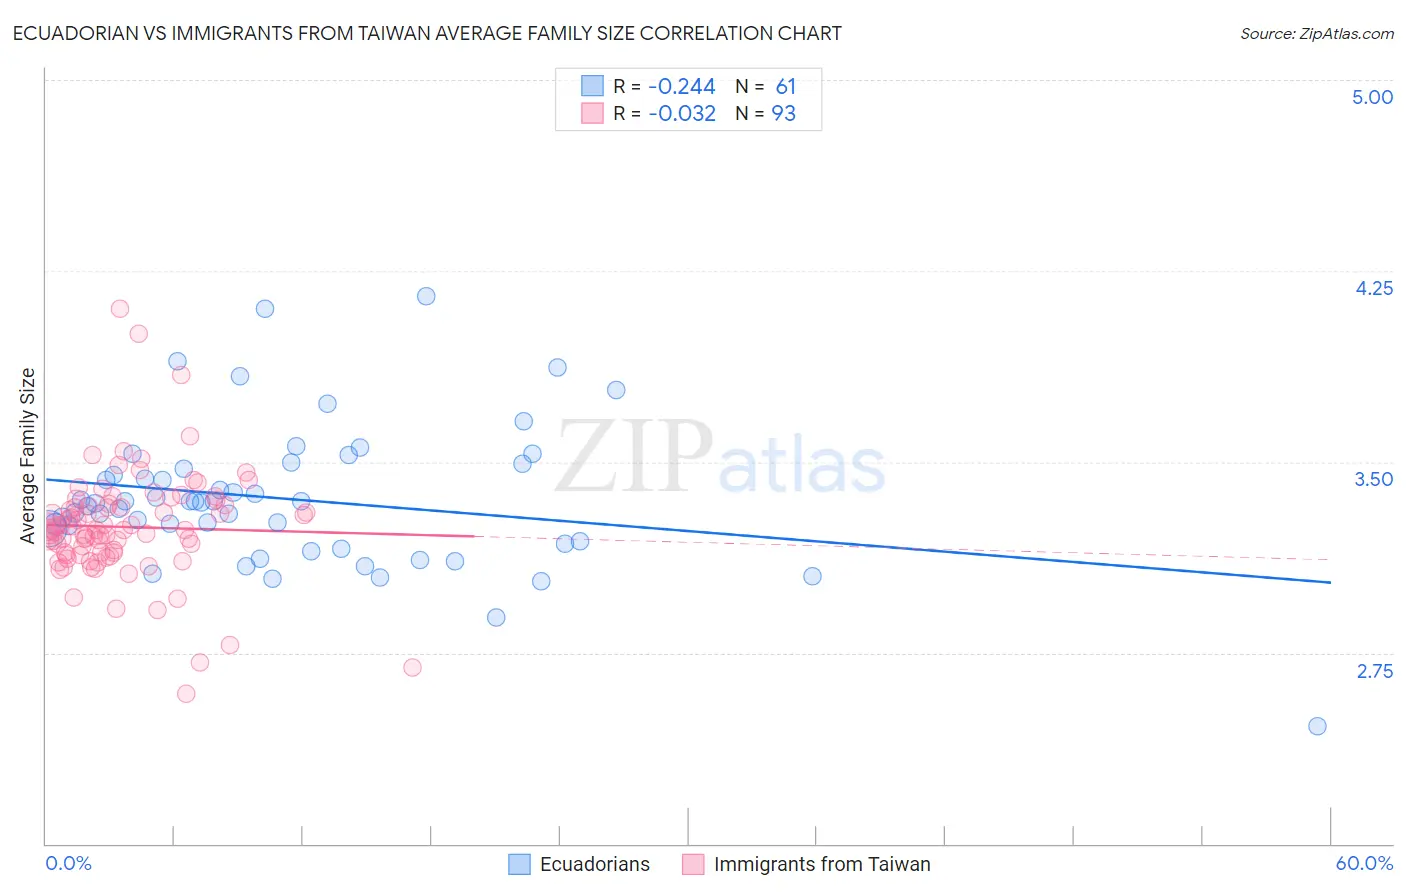
Ecuadorian vs Immigrants from Taiwan Average Family Size Correlation Chart
The statistical analysis conducted on geographies consisting of 317,647,749 people shows a weak negative correlation between the proportion of Ecuadorians and average family size in the United States with a correlation coefficient (R) of -0.244 and weighted average of 3.32. Similarly, the statistical analysis conducted on geographies consisting of 298,119,083 people shows no correlation between the proportion of Immigrants from Taiwan and average family size in the United States with a correlation coefficient (R) of -0.032 and weighted average of 3.24, a difference of 2.4%.
Average Family Size Correlation Summary
| Measurement | Ecuadorian | Immigrants from Taiwan |
| Minimum | 2.46 | 2.59 |
| Maximum | 4.15 | 4.10 |
| Range | 1.69 | 1.51 |
| Mean | 3.35 | 3.24 |
| Median | 3.34 | 3.23 |
| Interquartile 25% (IQ1) | 3.19 | 3.14 |
| Interquartile 75% (IQ3) | 3.48 | 3.33 |
| Interquartile Range (IQR) | 0.30 | 0.20 |
| Standard Deviation (Sample) | 0.28 | 0.22 |
| Standard Deviation (Population) | 0.28 | 0.22 |
Similar Demographics by Average Family Size
Demographics Similar to Ecuadorians by Average Family Size
In terms of average family size, the demographic groups most similar to Ecuadorians are Immigrants from Afghanistan (3.32, a difference of 0.010%), Immigrants from Dominica (3.32, a difference of 0.040%), Immigrants from Nigeria (3.32, a difference of 0.050%), Lumbee (3.32, a difference of 0.080%), and Afghan (3.31, a difference of 0.090%).
| Demographics | Rating | Rank | Average Family Size |
| Immigrants | Barbados | 99.8 /100 | #75 | Exceptional 3.32 |
| Trinidadians and Tobagonians | 99.8 /100 | #76 | Exceptional 3.32 |
| Immigrants | Ecuador | 99.8 /100 | #77 | Exceptional 3.32 |
| Immigrants | Micronesia | 99.8 /100 | #78 | Exceptional 3.32 |
| British West Indians | 99.8 /100 | #79 | Exceptional 3.32 |
| Lumbee | 99.8 /100 | #80 | Exceptional 3.32 |
| Immigrants | Dominica | 99.8 /100 | #81 | Exceptional 3.32 |
| Ecuadorians | 99.8 /100 | #82 | Exceptional 3.32 |
| Immigrants | Afghanistan | 99.8 /100 | #83 | Exceptional 3.32 |
| Immigrants | Nigeria | 99.7 /100 | #84 | Exceptional 3.32 |
| Afghans | 99.7 /100 | #85 | Exceptional 3.31 |
| Jamaicans | 99.7 /100 | #86 | Exceptional 3.31 |
| Immigrants | Peru | 99.7 /100 | #87 | Exceptional 3.31 |
| Immigrants | Bolivia | 99.6 /100 | #88 | Exceptional 3.31 |
| Malaysians | 99.6 /100 | #89 | Exceptional 3.31 |
Demographics Similar to Immigrants from Taiwan by Average Family Size
In terms of average family size, the demographic groups most similar to Immigrants from Taiwan are Seminole (3.24, a difference of 0.0%), Immigrants from Uzbekistan (3.24, a difference of 0.020%), Immigrants from Egypt (3.24, a difference of 0.040%), Immigrants from Eritrea (3.24, a difference of 0.070%), and Iraqi (3.24, a difference of 0.080%).
| Demographics | Rating | Rank | Average Family Size |
| Assyrians/Chaldeans/Syriacs | 73.8 /100 | #149 | Good 3.24 |
| Indians (Asian) | 73.6 /100 | #150 | Good 3.24 |
| Jordanians | 73.5 /100 | #151 | Good 3.24 |
| Spanish Americans | 72.5 /100 | #152 | Good 3.24 |
| Immigrants | Eritrea | 71.4 /100 | #153 | Good 3.24 |
| Immigrants | Egypt | 70.0 /100 | #154 | Good 3.24 |
| Seminole | 68.2 /100 | #155 | Good 3.24 |
| Immigrants | Taiwan | 68.1 /100 | #156 | Good 3.24 |
| Immigrants | Uzbekistan | 67.0 /100 | #157 | Good 3.24 |
| Iraqis | 64.3 /100 | #158 | Good 3.24 |
| Ethiopians | 63.9 /100 | #159 | Good 3.24 |
| Immigrants | Iraq | 63.7 /100 | #160 | Good 3.24 |
| Immigrants | Chile | 63.2 /100 | #161 | Good 3.24 |
| Immigrants | Uganda | 60.1 /100 | #162 | Good 3.23 |
| Uruguayans | 58.8 /100 | #163 | Average 3.23 |