Ecuadorian vs Immigrants from Argentina Unemployment Among Women with Children Under 18 years
COMPARE
Ecuadorian
Immigrants from Argentina
Unemployment Among Women with Children Under 18 years
Unemployment Among Women with Children Under 18 years Comparison
Ecuadorians
Immigrants from Argentina
6.5%
UNEMPLOYMENT AMONG WOMEN WITH CHILDREN UNDER 18 YEARS
0.0/ 100
METRIC RATING
309th/ 347
METRIC RANK
5.4%
UNEMPLOYMENT AMONG WOMEN WITH CHILDREN UNDER 18 YEARS
71.7/ 100
METRIC RATING
150th/ 347
METRIC RANK
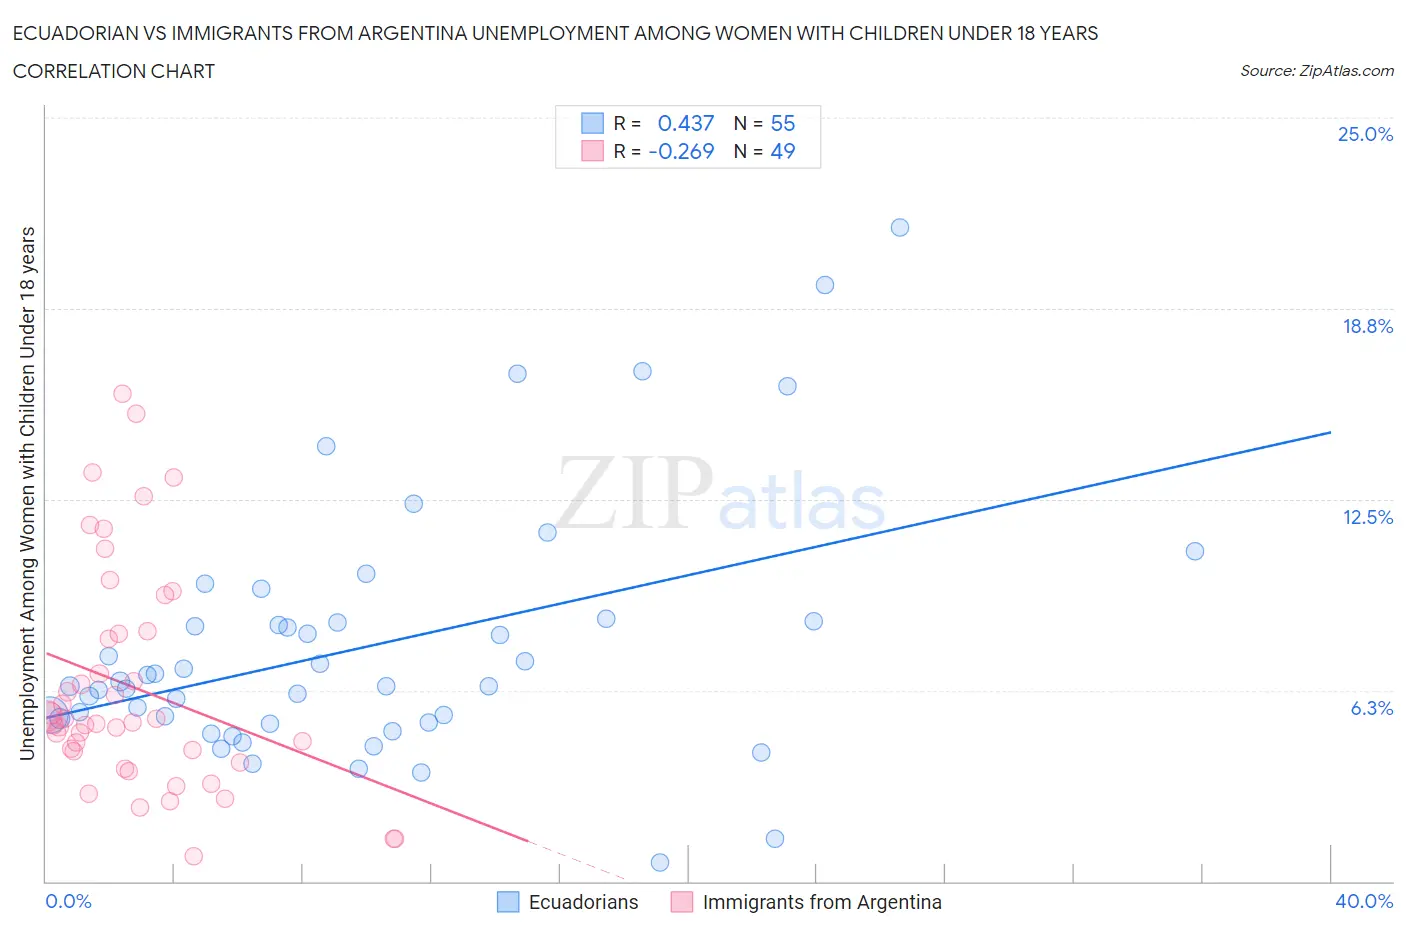
Ecuadorian vs Immigrants from Argentina Unemployment Among Women with Children Under 18 years Correlation Chart
The statistical analysis conducted on geographies consisting of 309,662,769 people shows a moderate positive correlation between the proportion of Ecuadorians and unemployment rate among women with children under the age of 18 in the United States with a correlation coefficient (R) of 0.437 and weighted average of 6.5%. Similarly, the statistical analysis conducted on geographies consisting of 258,415,879 people shows a weak negative correlation between the proportion of Immigrants from Argentina and unemployment rate among women with children under the age of 18 in the United States with a correlation coefficient (R) of -0.269 and weighted average of 5.4%, a difference of 22.2%.
Unemployment Among Women with Children Under 18 years Correlation Summary
| Measurement | Ecuadorian | Immigrants from Argentina |
| Minimum | 0.60% | 0.80% |
| Maximum | 21.4% | 16.0% |
| Range | 20.8% | 15.2% |
| Mean | 7.7% | 6.3% |
| Median | 6.4% | 5.2% |
| Interquartile 25% (IQ1) | 5.2% | 4.1% |
| Interquartile 75% (IQ3) | 8.5% | 8.2% |
| Interquartile Range (IQR) | 3.3% | 4.1% |
| Standard Deviation (Sample) | 4.2% | 3.6% |
| Standard Deviation (Population) | 4.1% | 3.6% |
Similar Demographics by Unemployment Among Women with Children Under 18 years
Demographics Similar to Ecuadorians by Unemployment Among Women with Children Under 18 years
In terms of unemployment among women with children under 18 years, the demographic groups most similar to Ecuadorians are African (6.5%, a difference of 0.090%), Guyanese (6.6%, a difference of 0.24%), Belizean (6.5%, a difference of 0.31%), Immigrants from Guyana (6.5%, a difference of 0.38%), and Immigrants from Central America (6.5%, a difference of 0.43%).
| Demographics | Rating | Rank | Unemployment Among Women with Children Under 18 years |
| Immigrants | Armenia | 0.0 /100 | #302 | Tragic 6.5% |
| Immigrants | Honduras | 0.0 /100 | #303 | Tragic 6.5% |
| Vietnamese | 0.0 /100 | #304 | Tragic 6.5% |
| Immigrants | Central America | 0.0 /100 | #305 | Tragic 6.5% |
| Immigrants | Guyana | 0.0 /100 | #306 | Tragic 6.5% |
| Belizeans | 0.0 /100 | #307 | Tragic 6.5% |
| Africans | 0.0 /100 | #308 | Tragic 6.5% |
| Ecuadorians | 0.0 /100 | #309 | Tragic 6.5% |
| Guyanese | 0.0 /100 | #310 | Tragic 6.6% |
| Yaqui | 0.0 /100 | #311 | Tragic 6.6% |
| Immigrants | Mexico | 0.0 /100 | #312 | Tragic 6.6% |
| Hispanics or Latinos | 0.0 /100 | #313 | Tragic 6.6% |
| British West Indians | 0.0 /100 | #314 | Tragic 6.6% |
| Immigrants | West Indies | 0.0 /100 | #315 | Tragic 6.6% |
| Immigrants | Ecuador | 0.0 /100 | #316 | Tragic 6.6% |
Demographics Similar to Immigrants from Argentina by Unemployment Among Women with Children Under 18 years
In terms of unemployment among women with children under 18 years, the demographic groups most similar to Immigrants from Argentina are Immigrants from Kenya (5.4%, a difference of 0.040%), Immigrants from Iran (5.4%, a difference of 0.050%), Immigrants from South Eastern Asia (5.4%, a difference of 0.060%), Carpatho Rusyn (5.4%, a difference of 0.080%), and Immigrants from Latvia (5.4%, a difference of 0.080%).
| Demographics | Rating | Rank | Unemployment Among Women with Children Under 18 years |
| Chileans | 75.0 /100 | #143 | Good 5.3% |
| Immigrants | England | 74.9 /100 | #144 | Good 5.3% |
| Immigrants | Egypt | 74.0 /100 | #145 | Good 5.3% |
| Immigrants | Belarus | 73.4 /100 | #146 | Good 5.3% |
| Bangladeshis | 73.2 /100 | #147 | Good 5.3% |
| Immigrants | Western Europe | 72.8 /100 | #148 | Good 5.4% |
| Immigrants | Kenya | 72.2 /100 | #149 | Good 5.4% |
| Immigrants | Argentina | 71.7 /100 | #150 | Good 5.4% |
| Immigrants | Iran | 71.1 /100 | #151 | Good 5.4% |
| Immigrants | South Eastern Asia | 71.1 /100 | #152 | Good 5.4% |
| Carpatho Rusyns | 70.8 /100 | #153 | Good 5.4% |
| Immigrants | Latvia | 70.8 /100 | #154 | Good 5.4% |
| Koreans | 70.5 /100 | #155 | Good 5.4% |
| South Africans | 70.3 /100 | #156 | Good 5.4% |
| German Russians | 70.2 /100 | #157 | Good 5.4% |