Ecuadorian vs Immigrants from South America Unemployment Among Seniors over 65 years
COMPARE
Ecuadorian
Immigrants from South America
Unemployment Among Seniors over 65 years
Unemployment Among Seniors over 65 years Comparison
Ecuadorians
Immigrants from South America
5.6%
UNEMPLOYMENT AMONG SENIORS OVER 65 YEARS
0.0/ 100
METRIC RATING
306th/ 347
METRIC RANK
5.5%
UNEMPLOYMENT AMONG SENIORS OVER 65 YEARS
0.1/ 100
METRIC RATING
280th/ 347
METRIC RANK
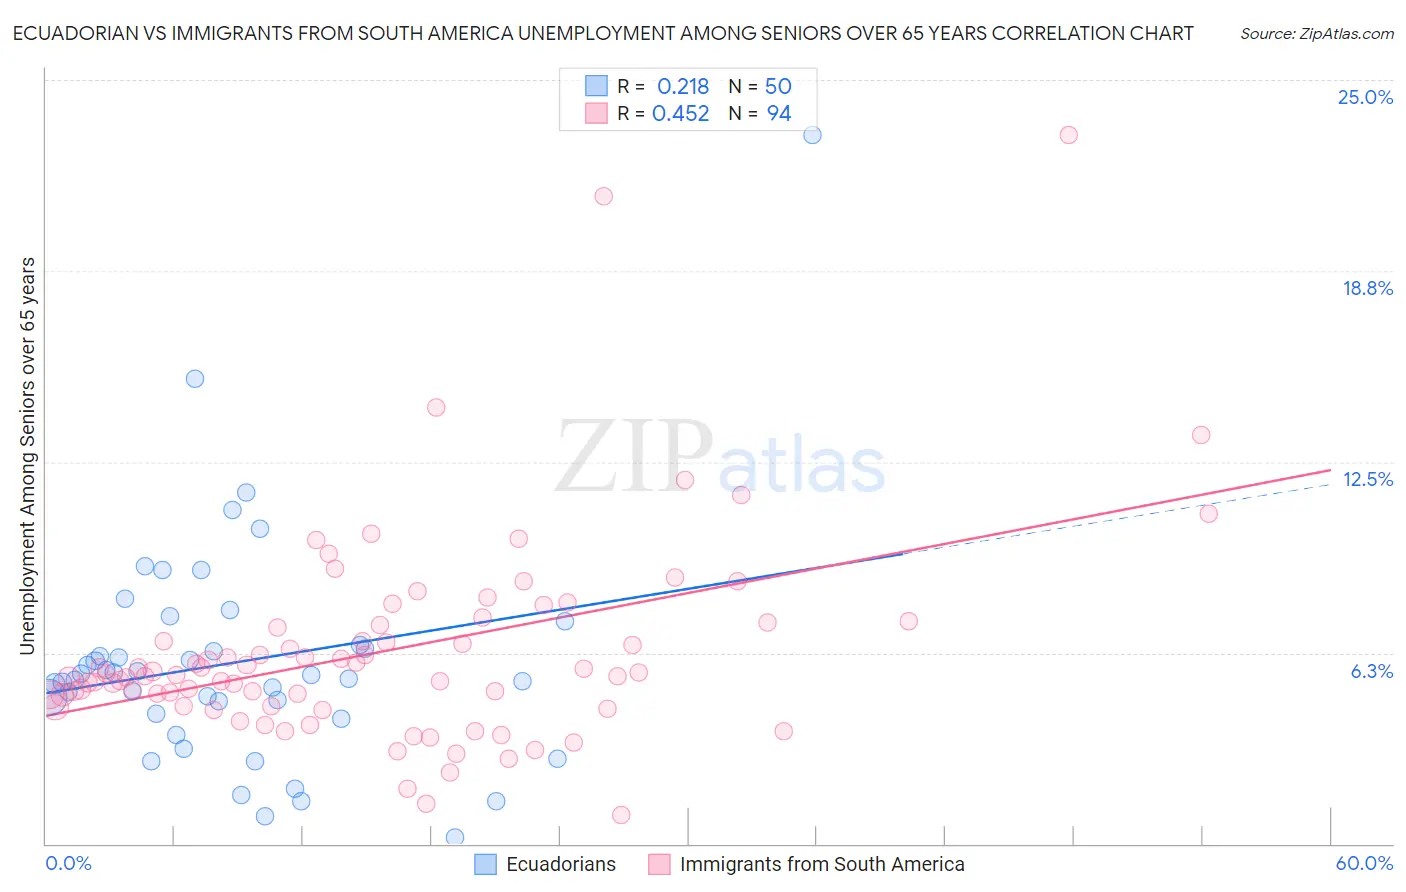
Ecuadorian vs Immigrants from South America Unemployment Among Seniors over 65 years Correlation Chart
The statistical analysis conducted on geographies consisting of 294,826,024 people shows a weak positive correlation between the proportion of Ecuadorians and unemployment rate amomg seniors over the age of 65 in the United States with a correlation coefficient (R) of 0.218 and weighted average of 5.6%. Similarly, the statistical analysis conducted on geographies consisting of 424,495,518 people shows a moderate positive correlation between the proportion of Immigrants from South America and unemployment rate amomg seniors over the age of 65 in the United States with a correlation coefficient (R) of 0.452 and weighted average of 5.5%, a difference of 2.7%.
Unemployment Among Seniors over 65 years Correlation Summary
| Measurement | Ecuadorian | Immigrants from South America |
| Minimum | 0.20% | 0.95% |
| Maximum | 23.2% | 23.2% |
| Range | 23.0% | 22.3% |
| Mean | 5.9% | 6.3% |
| Median | 5.5% | 5.5% |
| Interquartile 25% (IQ1) | 4.2% | 4.5% |
| Interquartile 75% (IQ3) | 6.5% | 7.2% |
| Interquartile Range (IQR) | 2.3% | 2.6% |
| Standard Deviation (Sample) | 3.8% | 3.4% |
| Standard Deviation (Population) | 3.7% | 3.3% |
Similar Demographics by Unemployment Among Seniors over 65 years
Demographics Similar to Ecuadorians by Unemployment Among Seniors over 65 years
In terms of unemployment among seniors over 65 years, the demographic groups most similar to Ecuadorians are Mexican (5.6%, a difference of 0.040%), Portuguese (5.6%, a difference of 0.050%), Immigrants from St. Vincent and the Grenadines (5.6%, a difference of 0.14%), Liberian (5.6%, a difference of 0.21%), and Immigrants from Latin America (5.6%, a difference of 0.28%).
| Demographics | Rating | Rank | Unemployment Among Seniors over 65 years |
| Guyanese | 0.0 /100 | #299 | Tragic 5.6% |
| Zimbabweans | 0.0 /100 | #300 | Tragic 5.6% |
| Hispanics or Latinos | 0.0 /100 | #301 | Tragic 5.6% |
| Guatemalans | 0.0 /100 | #302 | Tragic 5.6% |
| Immigrants | Latin America | 0.0 /100 | #303 | Tragic 5.6% |
| Liberians | 0.0 /100 | #304 | Tragic 5.6% |
| Mexicans | 0.0 /100 | #305 | Tragic 5.6% |
| Ecuadorians | 0.0 /100 | #306 | Tragic 5.6% |
| Portuguese | 0.0 /100 | #307 | Tragic 5.6% |
| Immigrants | St. Vincent and the Grenadines | 0.0 /100 | #308 | Tragic 5.6% |
| Immigrants | Guatemala | 0.0 /100 | #309 | Tragic 5.6% |
| Salvadorans | 0.0 /100 | #310 | Tragic 5.6% |
| Immigrants | Guyana | 0.0 /100 | #311 | Tragic 5.6% |
| Immigrants | Ecuador | 0.0 /100 | #312 | Tragic 5.6% |
| Barbadians | 0.0 /100 | #313 | Tragic 5.6% |
Demographics Similar to Immigrants from South America by Unemployment Among Seniors over 65 years
In terms of unemployment among seniors over 65 years, the demographic groups most similar to Immigrants from South America are Brazilian (5.5%, a difference of 0.040%), Immigrants from Norway (5.5%, a difference of 0.15%), Colville (5.4%, a difference of 0.16%), Immigrants from Western Africa (5.4%, a difference of 0.27%), and Immigrants from Belize (5.5%, a difference of 0.28%).
| Demographics | Rating | Rank | Unemployment Among Seniors over 65 years |
| Immigrants | Nigeria | 0.1 /100 | #273 | Tragic 5.4% |
| Immigrants | Brazil | 0.1 /100 | #274 | Tragic 5.4% |
| Mexican American Indians | 0.1 /100 | #275 | Tragic 5.4% |
| Pueblo | 0.1 /100 | #276 | Tragic 5.4% |
| Immigrants | Western Africa | 0.1 /100 | #277 | Tragic 5.4% |
| Colville | 0.1 /100 | #278 | Tragic 5.4% |
| Brazilians | 0.1 /100 | #279 | Tragic 5.5% |
| Immigrants | South America | 0.1 /100 | #280 | Tragic 5.5% |
| Immigrants | Norway | 0.0 /100 | #281 | Tragic 5.5% |
| Immigrants | Belize | 0.0 /100 | #282 | Tragic 5.5% |
| Immigrants | Haiti | 0.0 /100 | #283 | Tragic 5.5% |
| Immigrants | Liberia | 0.0 /100 | #284 | Tragic 5.5% |
| Central Americans | 0.0 /100 | #285 | Tragic 5.5% |
| Immigrants | Barbados | 0.0 /100 | #286 | Tragic 5.5% |
| Venezuelans | 0.0 /100 | #287 | Tragic 5.5% |