Creek vs Immigrants from South America Unemployment Among Seniors over 65 years
COMPARE
Creek
Immigrants from South America
Unemployment Among Seniors over 65 years
Unemployment Among Seniors over 65 years Comparison
Creek
Immigrants from South America
4.6%
UNEMPLOYMENT AMONG SENIORS OVER 65 YEARS
100.0/ 100
METRIC RATING
17th/ 347
METRIC RANK
5.5%
UNEMPLOYMENT AMONG SENIORS OVER 65 YEARS
0.1/ 100
METRIC RATING
280th/ 347
METRIC RANK
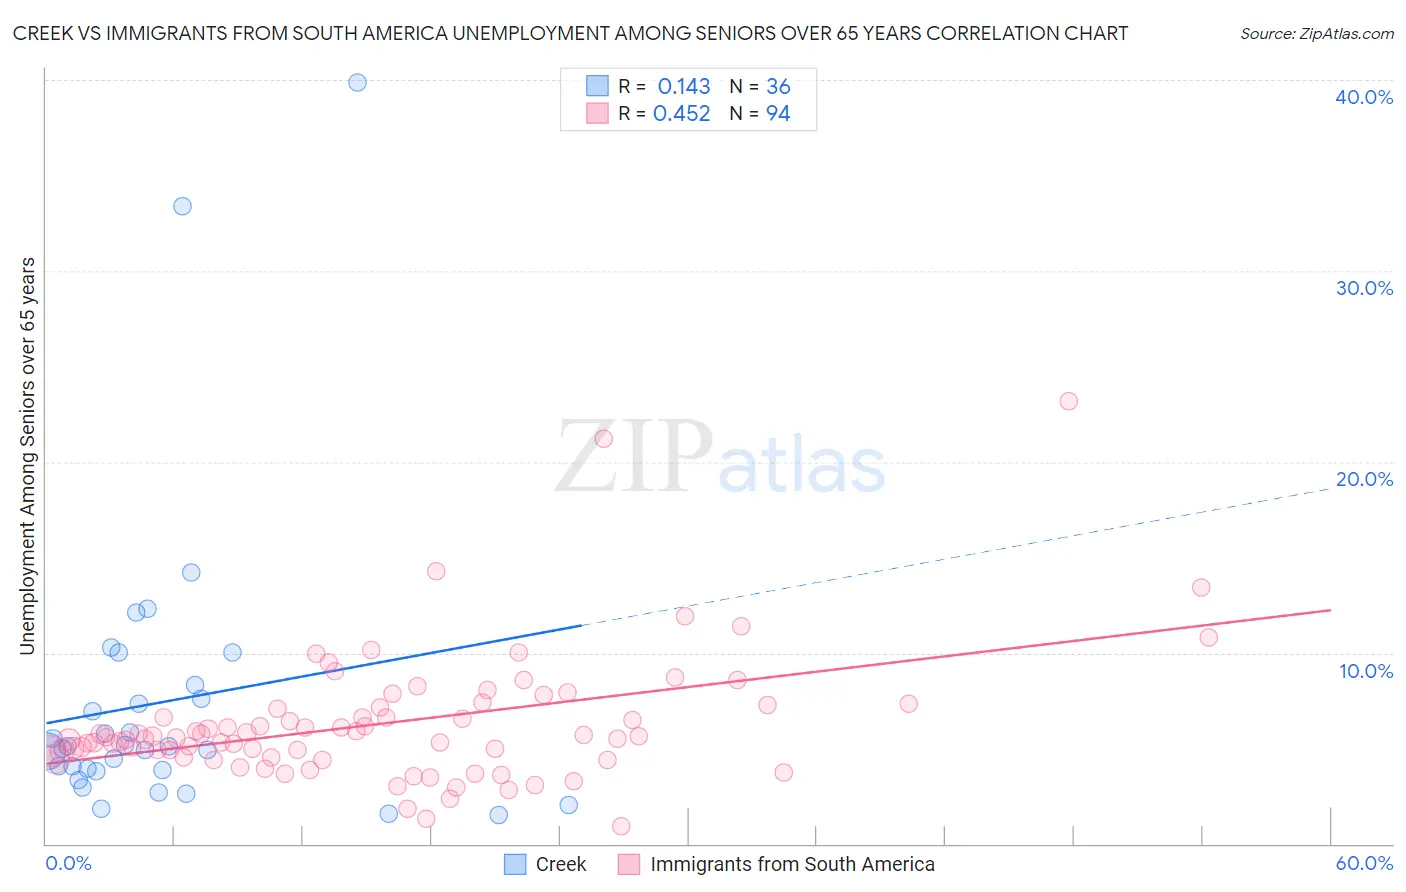
Creek vs Immigrants from South America Unemployment Among Seniors over 65 years Correlation Chart
The statistical analysis conducted on geographies consisting of 165,420,086 people shows a poor positive correlation between the proportion of Creek and unemployment rate amomg seniors over the age of 65 in the United States with a correlation coefficient (R) of 0.143 and weighted average of 4.6%. Similarly, the statistical analysis conducted on geographies consisting of 424,495,518 people shows a moderate positive correlation between the proportion of Immigrants from South America and unemployment rate amomg seniors over the age of 65 in the United States with a correlation coefficient (R) of 0.452 and weighted average of 5.5%, a difference of 17.6%.
Unemployment Among Seniors over 65 years Correlation Summary
| Measurement | Creek | Immigrants from South America |
| Minimum | 1.5% | 0.95% |
| Maximum | 39.9% | 23.2% |
| Range | 38.4% | 22.3% |
| Mean | 7.4% | 6.3% |
| Median | 5.0% | 5.5% |
| Interquartile 25% (IQ1) | 3.8% | 4.5% |
| Interquartile 75% (IQ3) | 8.0% | 7.2% |
| Interquartile Range (IQR) | 4.1% | 2.6% |
| Standard Deviation (Sample) | 7.9% | 3.4% |
| Standard Deviation (Population) | 7.8% | 3.3% |
Similar Demographics by Unemployment Among Seniors over 65 years
Demographics Similar to Creek by Unemployment Among Seniors over 65 years
In terms of unemployment among seniors over 65 years, the demographic groups most similar to Creek are Lumbee (4.6%, a difference of 0.11%), Immigrants from Burma/Myanmar (4.6%, a difference of 0.11%), Menominee (4.6%, a difference of 0.19%), Immigrants from Eritrea (4.7%, a difference of 0.29%), and Cuban (4.6%, a difference of 0.63%).
| Demographics | Rating | Rank | Unemployment Among Seniors over 65 years |
| Immigrants | Zaire | 100.0 /100 | #10 | Exceptional 4.5% |
| Comanche | 100.0 /100 | #11 | Exceptional 4.6% |
| Osage | 100.0 /100 | #12 | Exceptional 4.6% |
| Cubans | 100.0 /100 | #13 | Exceptional 4.6% |
| Menominee | 100.0 /100 | #14 | Exceptional 4.6% |
| Lumbee | 100.0 /100 | #15 | Exceptional 4.6% |
| Immigrants | Burma/Myanmar | 100.0 /100 | #16 | Exceptional 4.6% |
| Creek | 100.0 /100 | #17 | Exceptional 4.6% |
| Immigrants | Eritrea | 100.0 /100 | #18 | Exceptional 4.7% |
| Lebanese | 100.0 /100 | #19 | Exceptional 4.7% |
| Immigrants | Nepal | 100.0 /100 | #20 | Exceptional 4.7% |
| Norwegians | 100.0 /100 | #21 | Exceptional 4.7% |
| Czechs | 100.0 /100 | #22 | Exceptional 4.7% |
| Kenyans | 100.0 /100 | #23 | Exceptional 4.7% |
| Iraqis | 100.0 /100 | #24 | Exceptional 4.7% |
Demographics Similar to Immigrants from South America by Unemployment Among Seniors over 65 years
In terms of unemployment among seniors over 65 years, the demographic groups most similar to Immigrants from South America are Brazilian (5.5%, a difference of 0.040%), Immigrants from Norway (5.5%, a difference of 0.15%), Colville (5.4%, a difference of 0.16%), Immigrants from Western Africa (5.4%, a difference of 0.27%), and Immigrants from Belize (5.5%, a difference of 0.28%).
| Demographics | Rating | Rank | Unemployment Among Seniors over 65 years |
| Immigrants | Nigeria | 0.1 /100 | #273 | Tragic 5.4% |
| Immigrants | Brazil | 0.1 /100 | #274 | Tragic 5.4% |
| Mexican American Indians | 0.1 /100 | #275 | Tragic 5.4% |
| Pueblo | 0.1 /100 | #276 | Tragic 5.4% |
| Immigrants | Western Africa | 0.1 /100 | #277 | Tragic 5.4% |
| Colville | 0.1 /100 | #278 | Tragic 5.4% |
| Brazilians | 0.1 /100 | #279 | Tragic 5.5% |
| Immigrants | South America | 0.1 /100 | #280 | Tragic 5.5% |
| Immigrants | Norway | 0.0 /100 | #281 | Tragic 5.5% |
| Immigrants | Belize | 0.0 /100 | #282 | Tragic 5.5% |
| Immigrants | Haiti | 0.0 /100 | #283 | Tragic 5.5% |
| Immigrants | Liberia | 0.0 /100 | #284 | Tragic 5.5% |
| Central Americans | 0.0 /100 | #285 | Tragic 5.5% |
| Immigrants | Barbados | 0.0 /100 | #286 | Tragic 5.5% |
| Venezuelans | 0.0 /100 | #287 | Tragic 5.5% |