Apache vs Immigrants from West Indies Unemployment Among Ages 60 to 64 years
COMPARE
Apache
Immigrants from West Indies
Unemployment Among Ages 60 to 64 years
Unemployment Among Ages 60 to 64 years Comparison
Apache
Immigrants from West Indies
6.0%
UNEMPLOYMENT AMONG AGES 60 TO 64 YEARS
0.0/ 100
METRIC RATING
328th/ 347
METRIC RANK
5.5%
UNEMPLOYMENT AMONG AGES 60 TO 64 YEARS
0.0/ 100
METRIC RATING
312th/ 347
METRIC RANK
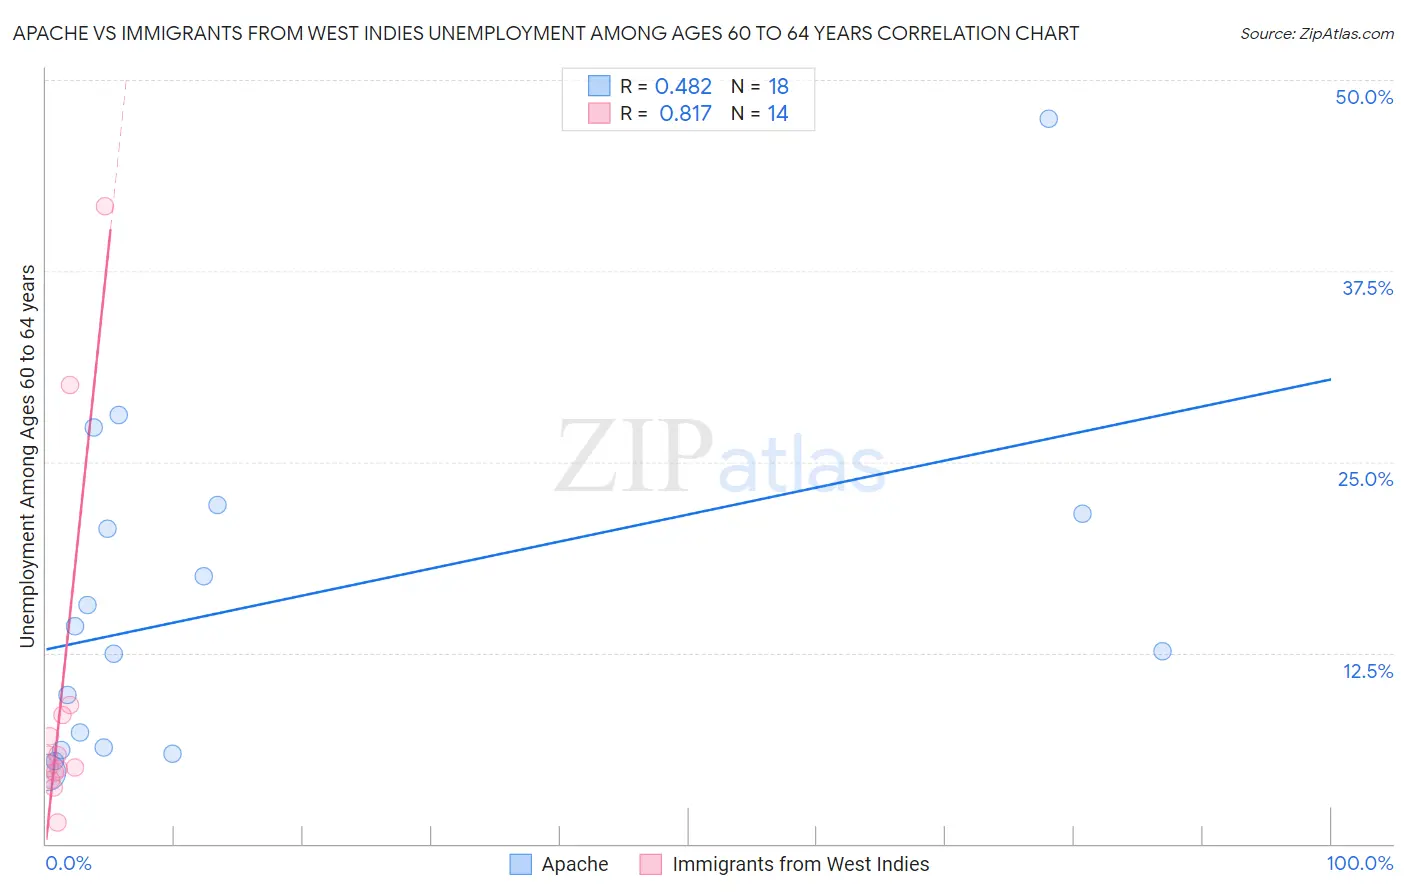
Apache vs Immigrants from West Indies Unemployment Among Ages 60 to 64 years Correlation Chart
The statistical analysis conducted on geographies consisting of 214,919,581 people shows a moderate positive correlation between the proportion of Apache and unemployment rate among population between the ages 60 and 64 in the United States with a correlation coefficient (R) of 0.482 and weighted average of 6.0%. Similarly, the statistical analysis conducted on geographies consisting of 71,195,820 people shows a very strong positive correlation between the proportion of Immigrants from West Indies and unemployment rate among population between the ages 60 and 64 in the United States with a correlation coefficient (R) of 0.817 and weighted average of 5.5%, a difference of 8.8%.
Unemployment Among Ages 60 to 64 years Correlation Summary
| Measurement | Apache | Immigrants from West Indies |
| Minimum | 4.6% | 1.4% |
| Maximum | 47.5% | 41.7% |
| Range | 42.9% | 40.3% |
| Mean | 15.8% | 9.8% |
| Median | 13.4% | 5.4% |
| Interquartile 25% (IQ1) | 6.3% | 4.7% |
| Interquartile 75% (IQ3) | 21.6% | 8.4% |
| Interquartile Range (IQR) | 15.3% | 3.8% |
| Standard Deviation (Sample) | 10.9% | 11.4% |
| Standard Deviation (Population) | 10.6% | 11.0% |
Demographics Similar to Apache and Immigrants from West Indies by Unemployment Among Ages 60 to 64 years
In terms of unemployment among ages 60 to 64 years, the demographic groups most similar to Apache are Immigrants from Bangladesh (6.0%, a difference of 0.010%), Immigrants from Armenia (6.0%, a difference of 0.27%), Immigrants from Grenada (5.9%, a difference of 1.4%), Immigrants from St. Vincent and the Grenadines (5.9%, a difference of 1.4%), and Paiute (5.8%, a difference of 2.4%). Similarly, the demographic groups most similar to Immigrants from West Indies are U.S. Virgin Islander (5.5%, a difference of 0.19%), British West Indian (5.5%, a difference of 0.20%), Belizean (5.5%, a difference of 0.70%), Guyanese (5.5%, a difference of 0.87%), and Cree (5.6%, a difference of 2.2%).
| Demographics | Rating | Rank | Unemployment Among Ages 60 to 64 years |
| British West Indians | 0.0 /100 | #310 | Tragic 5.5% |
| U.S. Virgin Islanders | 0.0 /100 | #311 | Tragic 5.5% |
| Immigrants | West Indies | 0.0 /100 | #312 | Tragic 5.5% |
| Belizeans | 0.0 /100 | #313 | Tragic 5.5% |
| Guyanese | 0.0 /100 | #314 | Tragic 5.5% |
| Cree | 0.0 /100 | #315 | Tragic 5.6% |
| Cheyenne | 0.0 /100 | #316 | Tragic 5.6% |
| Shoshone | 0.0 /100 | #317 | Tragic 5.7% |
| Natives/Alaskans | 0.0 /100 | #318 | Tragic 5.7% |
| Immigrants | Belize | 0.0 /100 | #319 | Tragic 5.7% |
| Colville | 0.0 /100 | #320 | Tragic 5.7% |
| Dutch West Indians | 0.0 /100 | #321 | Tragic 5.7% |
| Ecuadorians | 0.0 /100 | #322 | Tragic 5.8% |
| Alsatians | 0.0 /100 | #323 | Tragic 5.8% |
| Immigrants | Ecuador | 0.0 /100 | #324 | Tragic 5.8% |
| Paiute | 0.0 /100 | #325 | Tragic 5.8% |
| Immigrants | St. Vincent and the Grenadines | 0.0 /100 | #326 | Tragic 5.9% |
| Immigrants | Grenada | 0.0 /100 | #327 | Tragic 5.9% |
| Apache | 0.0 /100 | #328 | Tragic 6.0% |
| Immigrants | Bangladesh | 0.0 /100 | #329 | Tragic 6.0% |
| Immigrants | Armenia | 0.0 /100 | #330 | Tragic 6.0% |