Dutch West Indian vs Immigrants from Latin America Unemployment Among Ages 55 to 59 years
COMPARE
Dutch West Indian
Immigrants from Latin America
Unemployment Among Ages 55 to 59 years
Unemployment Among Ages 55 to 59 years Comparison
Dutch West Indians
Immigrants from Latin America
5.3%
UNEMPLOYMENT AMONG AGES 55 TO 59 YEARS
0.0/ 100
METRIC RATING
295th/ 347
METRIC RANK
5.2%
UNEMPLOYMENT AMONG AGES 55 TO 59 YEARS
0.0/ 100
METRIC RATING
277th/ 347
METRIC RANK
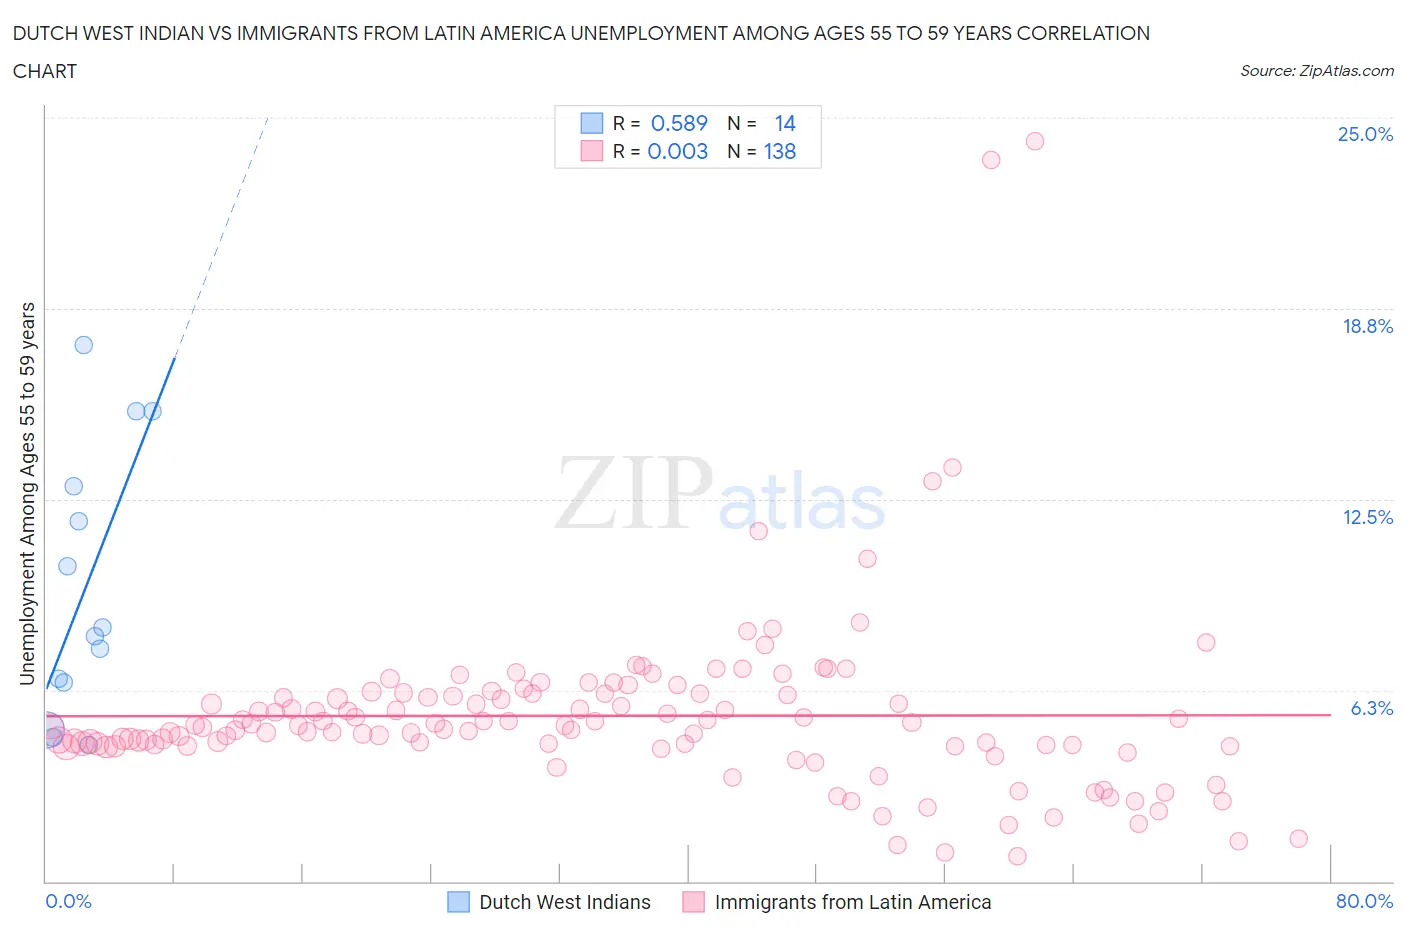
Dutch West Indian vs Immigrants from Latin America Unemployment Among Ages 55 to 59 years Correlation Chart
The statistical analysis conducted on geographies consisting of 81,812,889 people shows a substantial positive correlation between the proportion of Dutch West Indians and unemployment rate among population between the ages 55 and 59 in the United States with a correlation coefficient (R) of 0.589 and weighted average of 5.3%. Similarly, the statistical analysis conducted on geographies consisting of 483,849,302 people shows no correlation between the proportion of Immigrants from Latin America and unemployment rate among population between the ages 55 and 59 in the United States with a correlation coefficient (R) of 0.003 and weighted average of 5.2%, a difference of 2.0%.
Unemployment Among Ages 55 to 59 years Correlation Summary
| Measurement | Dutch West Indian | Immigrants from Latin America |
| Minimum | 4.5% | 0.80% |
| Maximum | 17.6% | 24.2% |
| Range | 13.1% | 23.4% |
| Mean | 9.6% | 5.4% |
| Median | 8.2% | 5.1% |
| Interquartile 25% (IQ1) | 6.5% | 4.4% |
| Interquartile 75% (IQ3) | 12.9% | 6.1% |
| Interquartile Range (IQR) | 6.4% | 1.7% |
| Standard Deviation (Sample) | 4.3% | 3.0% |
| Standard Deviation (Population) | 4.2% | 3.0% |
Demographics Similar to Dutch West Indians and Immigrants from Latin America by Unemployment Among Ages 55 to 59 years
In terms of unemployment among ages 55 to 59 years, the demographic groups most similar to Dutch West Indians are Barbadian (5.3%, a difference of 0.040%), Cajun (5.3%, a difference of 0.12%), Immigrants from Grenada (5.3%, a difference of 0.24%), British West Indian (5.3%, a difference of 0.43%), and Trinidadian and Tobagonian (5.3%, a difference of 0.57%). Similarly, the demographic groups most similar to Immigrants from Latin America are West Indian (5.2%, a difference of 0.12%), Immigrants from Barbados (5.2%, a difference of 0.18%), Alsatian (5.2%, a difference of 0.29%), Immigrants from Uzbekistan (5.3%, a difference of 0.50%), and Guatemalan (5.3%, a difference of 0.65%).
| Demographics | Rating | Rank | Unemployment Among Ages 55 to 59 years |
| West Indians | 0.0 /100 | #276 | Tragic 5.2% |
| Immigrants | Latin America | 0.0 /100 | #277 | Tragic 5.2% |
| Immigrants | Barbados | 0.0 /100 | #278 | Tragic 5.2% |
| Alsatians | 0.0 /100 | #279 | Tragic 5.2% |
| Immigrants | Uzbekistan | 0.0 /100 | #280 | Tragic 5.3% |
| Guatemalans | 0.0 /100 | #281 | Tragic 5.3% |
| Immigrants | Trinidad and Tobago | 0.0 /100 | #282 | Tragic 5.3% |
| Apache | 0.0 /100 | #283 | Tragic 5.3% |
| Ghanaians | 0.0 /100 | #284 | Tragic 5.3% |
| Armenians | 0.0 /100 | #285 | Tragic 5.3% |
| Immigrants | Ghana | 0.0 /100 | #286 | Tragic 5.3% |
| Immigrants | Guatemala | 0.0 /100 | #287 | Tragic 5.3% |
| Immigrants | Israel | 0.0 /100 | #288 | Tragic 5.3% |
| Immigrants | Central America | 0.0 /100 | #289 | Tragic 5.3% |
| Sioux | 0.0 /100 | #290 | Tragic 5.3% |
| Trinidadians and Tobagonians | 0.0 /100 | #291 | Tragic 5.3% |
| British West Indians | 0.0 /100 | #292 | Tragic 5.3% |
| Immigrants | Grenada | 0.0 /100 | #293 | Tragic 5.3% |
| Cajuns | 0.0 /100 | #294 | Tragic 5.3% |
| Dutch West Indians | 0.0 /100 | #295 | Tragic 5.3% |
| Barbadians | 0.0 /100 | #296 | Tragic 5.3% |