Alaska Native vs Colville Unemployment Among Women with Children Under 18 years
COMPARE
Alaska Native
Colville
Unemployment Among Women with Children Under 18 years
Unemployment Among Women with Children Under 18 years Comparison
Alaska Natives
Colville
6.7%
UNEMPLOYMENT AMONG WOMEN WITH CHILDREN UNDER 18 YEARS
0.0/ 100
METRIC RATING
318th/ 347
METRIC RANK
7.4%
UNEMPLOYMENT AMONG WOMEN WITH CHILDREN UNDER 18 YEARS
0.0/ 100
METRIC RATING
330th/ 347
METRIC RANK
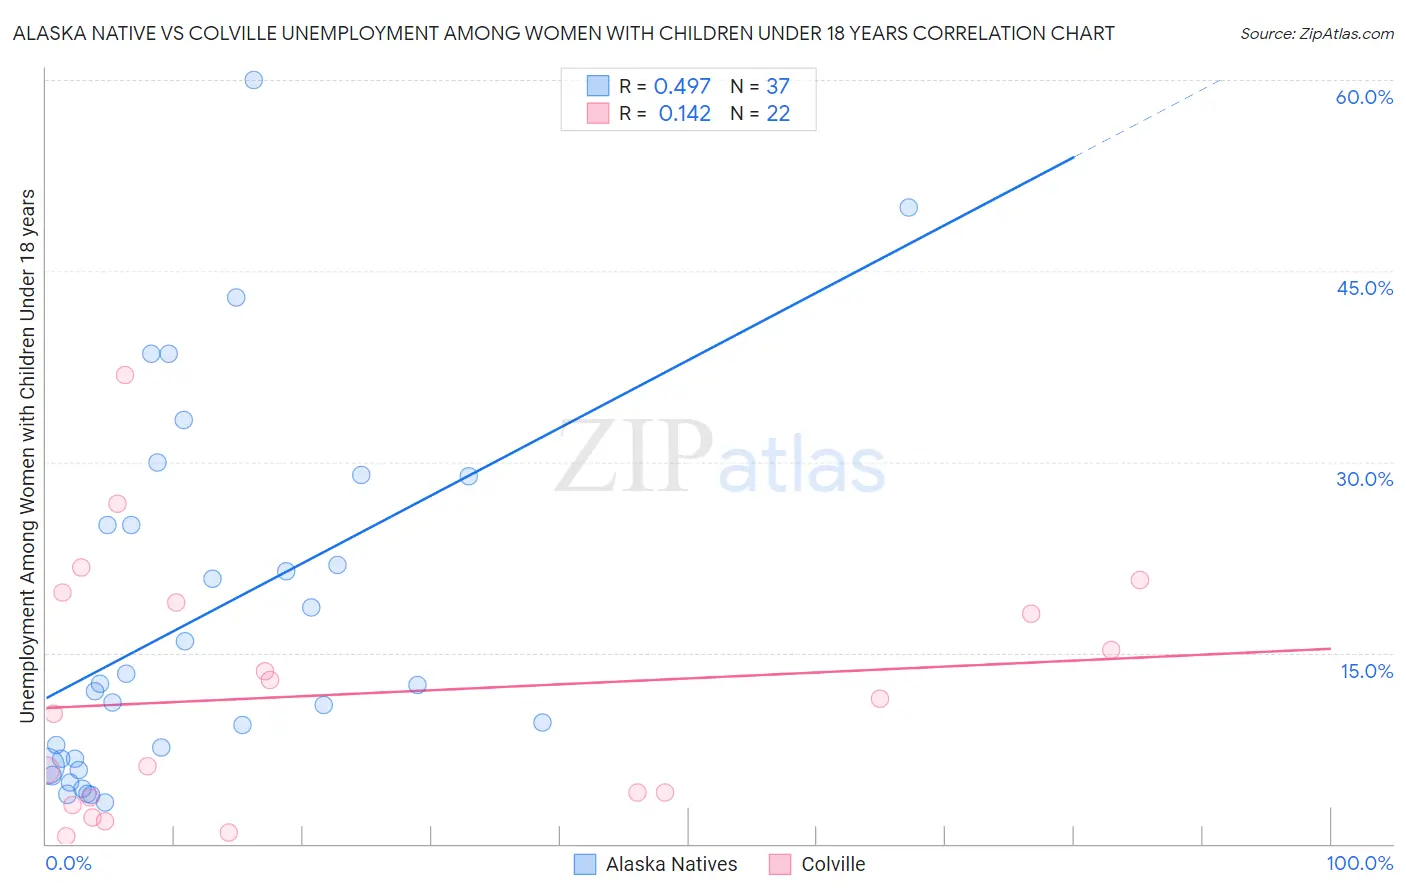
Alaska Native vs Colville Unemployment Among Women with Children Under 18 years Correlation Chart
The statistical analysis conducted on geographies consisting of 75,718,891 people shows a moderate positive correlation between the proportion of Alaska Natives and unemployment rate among women with children under the age of 18 in the United States with a correlation coefficient (R) of 0.497 and weighted average of 6.7%. Similarly, the statistical analysis conducted on geographies consisting of 34,331,468 people shows a poor positive correlation between the proportion of Colville and unemployment rate among women with children under the age of 18 in the United States with a correlation coefficient (R) of 0.142 and weighted average of 7.4%, a difference of 10.9%.
Unemployment Among Women with Children Under 18 years Correlation Summary
| Measurement | Alaska Native | Colville |
| Minimum | 3.2% | 0.60% |
| Maximum | 60.0% | 36.8% |
| Range | 56.8% | 36.2% |
| Mean | 17.9% | 11.7% |
| Median | 12.5% | 10.8% |
| Interquartile 25% (IQ1) | 6.4% | 3.6% |
| Interquartile 75% (IQ3) | 27.0% | 19.0% |
| Interquartile Range (IQR) | 20.6% | 15.4% |
| Standard Deviation (Sample) | 14.4% | 9.7% |
| Standard Deviation (Population) | 14.2% | 9.5% |
Demographics Similar to Alaska Natives and Colville by Unemployment Among Women with Children Under 18 years
In terms of unemployment among women with children under 18 years, the demographic groups most similar to Alaska Natives are Central American Indian (6.7%, a difference of 0.24%), Shoshone (6.6%, a difference of 0.29%), Immigrants from Ecuador (6.6%, a difference of 0.33%), Immigrants from Belize (6.7%, a difference of 0.33%), and U.S. Virgin Islander (6.7%, a difference of 0.39%). Similarly, the demographic groups most similar to Colville are Hopi (7.4%, a difference of 0.56%), Dominican (7.5%, a difference of 1.1%), Black/African American (7.3%, a difference of 1.5%), Immigrants from Dominican Republic (7.5%, a difference of 1.5%), and Native/Alaskan (7.2%, a difference of 1.9%).
| Demographics | Rating | Rank | Unemployment Among Women with Children Under 18 years |
| British West Indians | 0.0 /100 | #314 | Tragic 6.6% |
| Immigrants | West Indies | 0.0 /100 | #315 | Tragic 6.6% |
| Immigrants | Ecuador | 0.0 /100 | #316 | Tragic 6.6% |
| Shoshone | 0.0 /100 | #317 | Tragic 6.6% |
| Alaska Natives | 0.0 /100 | #318 | Tragic 6.7% |
| Central American Indians | 0.0 /100 | #319 | Tragic 6.7% |
| Immigrants | Belize | 0.0 /100 | #320 | Tragic 6.7% |
| U.S. Virgin Islanders | 0.0 /100 | #321 | Tragic 6.7% |
| Houma | 0.0 /100 | #322 | Tragic 6.8% |
| Pueblo | 0.0 /100 | #323 | Tragic 6.8% |
| Paiute | 0.0 /100 | #324 | Tragic 6.9% |
| Immigrants | Dominica | 0.0 /100 | #325 | Tragic 7.0% |
| Chippewa | 0.0 /100 | #326 | Tragic 7.0% |
| Lumbee | 0.0 /100 | #327 | Tragic 7.1% |
| Natives/Alaskans | 0.0 /100 | #328 | Tragic 7.2% |
| Blacks/African Americans | 0.0 /100 | #329 | Tragic 7.3% |
| Colville | 0.0 /100 | #330 | Tragic 7.4% |
| Hopi | 0.0 /100 | #331 | Tragic 7.4% |
| Dominicans | 0.0 /100 | #332 | Tragic 7.5% |
| Immigrants | Dominican Republic | 0.0 /100 | #333 | Tragic 7.5% |
| Cheyenne | 0.0 /100 | #334 | Tragic 7.8% |