Dominican vs Immigrants from Western Africa Unemployment Among Ages 60 to 64 years
COMPARE
Dominican
Immigrants from Western Africa
Unemployment Among Ages 60 to 64 years
Unemployment Among Ages 60 to 64 years Comparison
Dominicans
Immigrants from Western Africa
6.0%
UNEMPLOYMENT AMONG AGES 60 TO 64 YEARS
0.0/ 100
METRIC RATING
332nd/ 347
METRIC RANK
4.9%
UNEMPLOYMENT AMONG AGES 60 TO 64 YEARS
20.6/ 100
METRIC RATING
202nd/ 347
METRIC RANK
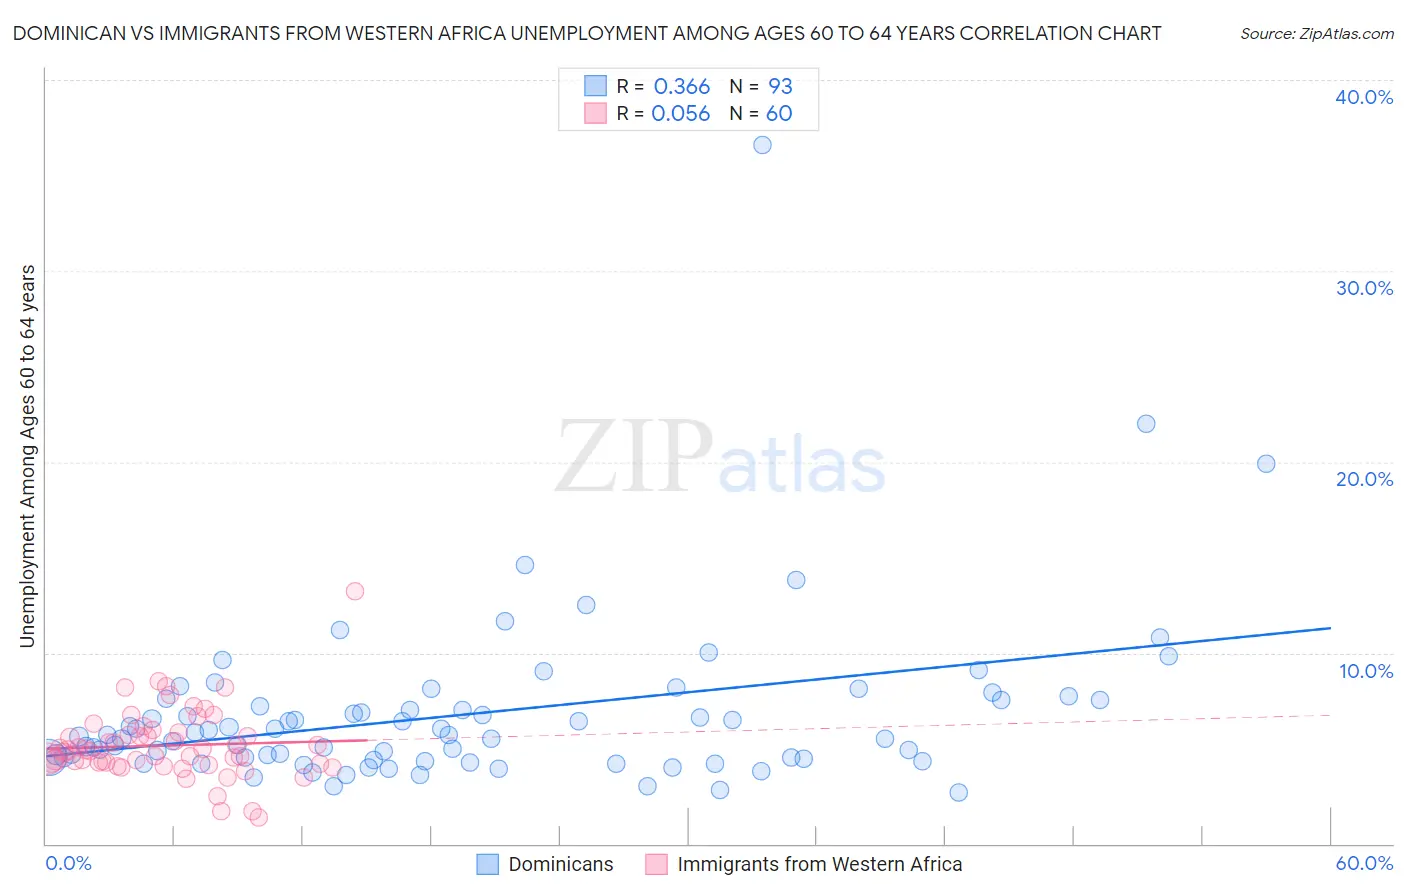
Dominican vs Immigrants from Western Africa Unemployment Among Ages 60 to 64 years Correlation Chart
The statistical analysis conducted on geographies consisting of 324,520,720 people shows a mild positive correlation between the proportion of Dominicans and unemployment rate among population between the ages 60 and 64 in the United States with a correlation coefficient (R) of 0.366 and weighted average of 6.0%. Similarly, the statistical analysis conducted on geographies consisting of 328,663,642 people shows a slight positive correlation between the proportion of Immigrants from Western Africa and unemployment rate among population between the ages 60 and 64 in the United States with a correlation coefficient (R) of 0.056 and weighted average of 4.9%, a difference of 21.6%.
Unemployment Among Ages 60 to 64 years Correlation Summary
| Measurement | Dominican | Immigrants from Western Africa |
| Minimum | 2.7% | 1.4% |
| Maximum | 36.6% | 13.2% |
| Range | 33.9% | 11.8% |
| Mean | 6.8% | 5.1% |
| Median | 5.7% | 4.9% |
| Interquartile 25% (IQ1) | 4.5% | 4.2% |
| Interquartile 75% (IQ3) | 7.5% | 5.8% |
| Interquartile Range (IQR) | 3.0% | 1.5% |
| Standard Deviation (Sample) | 4.5% | 1.9% |
| Standard Deviation (Population) | 4.4% | 1.8% |
Similar Demographics by Unemployment Among Ages 60 to 64 years
Demographics Similar to Dominicans by Unemployment Among Ages 60 to 64 years
In terms of unemployment among ages 60 to 64 years, the demographic groups most similar to Dominicans are Yakama (6.0%, a difference of 0.020%), Immigrants from Armenia (6.0%, a difference of 0.16%), Immigrants from Dominican Republic (6.0%, a difference of 0.35%), Immigrants from Bangladesh (6.0%, a difference of 0.42%), and Apache (6.0%, a difference of 0.43%).
| Demographics | Rating | Rank | Unemployment Among Ages 60 to 64 years |
| Paiute | 0.0 /100 | #325 | Tragic 5.8% |
| Immigrants | St. Vincent and the Grenadines | 0.0 /100 | #326 | Tragic 5.9% |
| Immigrants | Grenada | 0.0 /100 | #327 | Tragic 5.9% |
| Apache | 0.0 /100 | #328 | Tragic 6.0% |
| Immigrants | Bangladesh | 0.0 /100 | #329 | Tragic 6.0% |
| Immigrants | Armenia | 0.0 /100 | #330 | Tragic 6.0% |
| Yakama | 0.0 /100 | #331 | Tragic 6.0% |
| Dominicans | 0.0 /100 | #332 | Tragic 6.0% |
| Immigrants | Dominican Republic | 0.0 /100 | #333 | Tragic 6.0% |
| Puerto Ricans | 0.0 /100 | #334 | Tragic 6.1% |
| Vietnamese | 0.0 /100 | #335 | Tragic 6.1% |
| Kiowa | 0.0 /100 | #336 | Tragic 6.2% |
| Navajo | 0.0 /100 | #337 | Tragic 6.3% |
| Arapaho | 0.0 /100 | #338 | Tragic 6.3% |
| Tlingit-Haida | 0.0 /100 | #339 | Tragic 6.4% |
Demographics Similar to Immigrants from Western Africa by Unemployment Among Ages 60 to 64 years
In terms of unemployment among ages 60 to 64 years, the demographic groups most similar to Immigrants from Western Africa are Uruguayan (4.9%, a difference of 0.040%), Colombian (4.9%, a difference of 0.10%), Russian (4.9%, a difference of 0.10%), Immigrants from Czechoslovakia (4.9%, a difference of 0.15%), and Guamanian/Chamorro (4.9%, a difference of 0.16%).
| Demographics | Rating | Rank | Unemployment Among Ages 60 to 64 years |
| Immigrants | Austria | 26.6 /100 | #195 | Fair 4.9% |
| Immigrants | Asia | 25.7 /100 | #196 | Fair 4.9% |
| Immigrants | Eastern Europe | 25.2 /100 | #197 | Fair 4.9% |
| Guamanians/Chamorros | 23.7 /100 | #198 | Fair 4.9% |
| Immigrants | Vietnam | 23.7 /100 | #199 | Fair 4.9% |
| Immigrants | Czechoslovakia | 23.5 /100 | #200 | Fair 4.9% |
| Colombians | 22.7 /100 | #201 | Fair 4.9% |
| Immigrants | Western Africa | 20.6 /100 | #202 | Fair 4.9% |
| Uruguayans | 19.9 /100 | #203 | Poor 4.9% |
| Russians | 18.9 /100 | #204 | Poor 4.9% |
| Immigrants | Indonesia | 17.4 /100 | #205 | Poor 4.9% |
| New Zealanders | 17.4 /100 | #206 | Poor 4.9% |
| Chippewa | 17.3 /100 | #207 | Poor 4.9% |
| German Russians | 16.8 /100 | #208 | Poor 4.9% |
| Sierra Leoneans | 16.5 /100 | #209 | Poor 4.9% |