Delaware vs New Zealander 12th Grade, No Diploma
COMPARE
Delaware
New Zealander
12th Grade, No Diploma
12th Grade, No Diploma Comparison
Delaware
New Zealanders
91.2%
12TH GRADE, NO DIPLOMA
52.8/ 100
METRIC RATING
170th/ 347
METRIC RANK
92.8%
12TH GRADE, NO DIPLOMA
99.7/ 100
METRIC RATING
56th/ 347
METRIC RANK
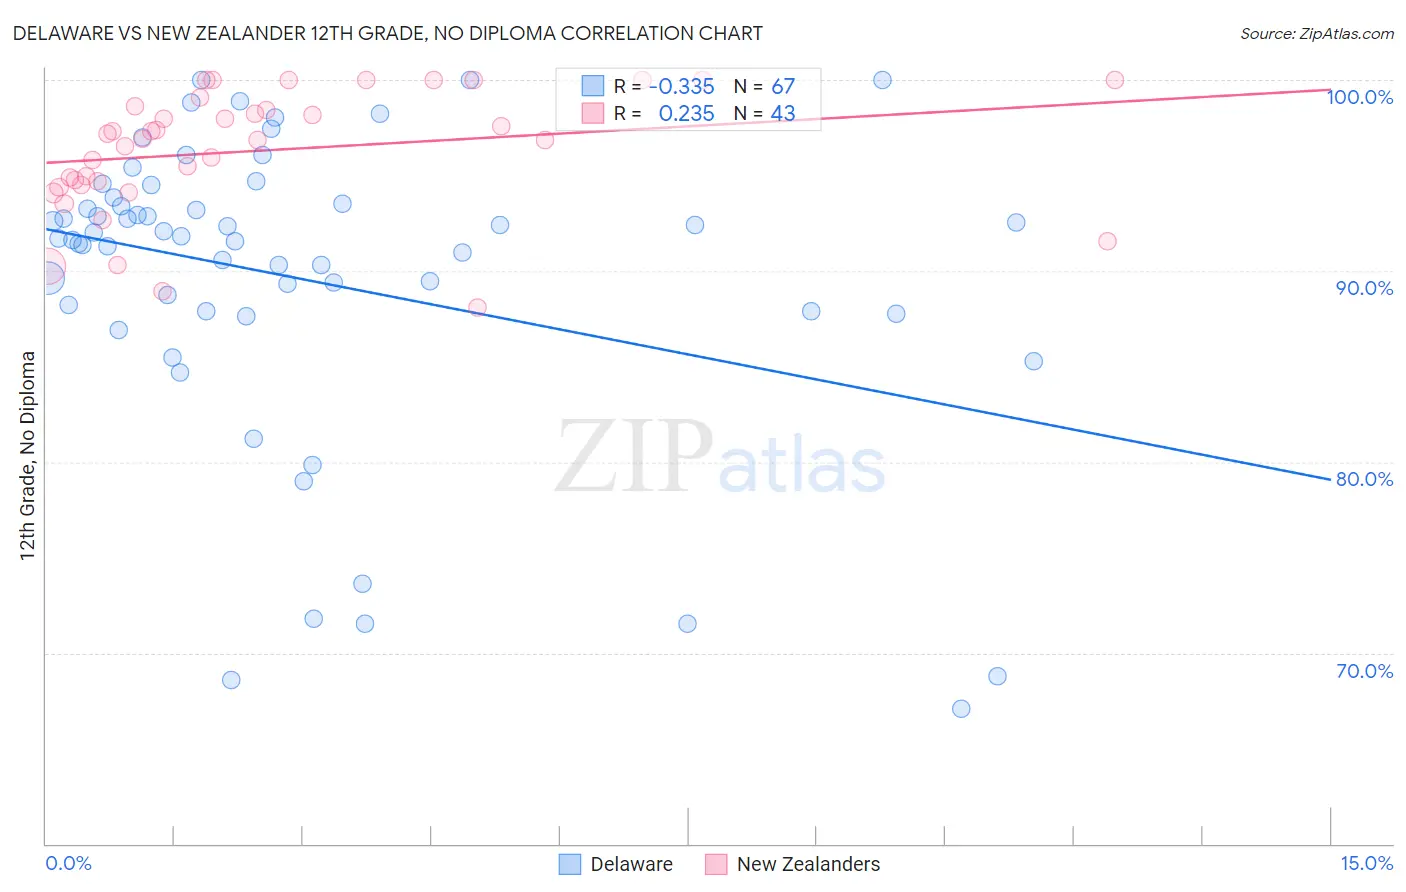
Delaware vs New Zealander 12th Grade, No Diploma Correlation Chart
The statistical analysis conducted on geographies consisting of 96,234,866 people shows a mild negative correlation between the proportion of Delaware and percentage of population with at least 12th grade (no diploma) education in the United States with a correlation coefficient (R) of -0.335 and weighted average of 91.2%. Similarly, the statistical analysis conducted on geographies consisting of 106,912,053 people shows a weak positive correlation between the proportion of New Zealanders and percentage of population with at least 12th grade (no diploma) education in the United States with a correlation coefficient (R) of 0.235 and weighted average of 92.8%, a difference of 1.8%.
12th Grade, No Diploma Correlation Summary
| Measurement | Delaware | New Zealander |
| Minimum | 67.1% | 88.1% |
| Maximum | 100.0% | 100.0% |
| Range | 32.9% | 11.9% |
| Mean | 89.6% | 96.3% |
| Median | 91.7% | 96.9% |
| Interquartile 25% (IQ1) | 87.9% | 94.5% |
| Interquartile 75% (IQ3) | 93.5% | 98.6% |
| Interquartile Range (IQR) | 5.6% | 4.1% |
| Standard Deviation (Sample) | 7.9% | 3.2% |
| Standard Deviation (Population) | 7.9% | 3.1% |
Similar Demographics by 12th Grade, No Diploma
Demographics Similar to Delaware by 12th Grade, No Diploma
In terms of 12th grade, no diploma, the demographic groups most similar to Delaware are Immigrants from Morocco (91.2%, a difference of 0.020%), Bermudan (91.2%, a difference of 0.020%), Immigrants from Indonesia (91.2%, a difference of 0.030%), Bolivian (91.2%, a difference of 0.030%), and Immigrants from Nepal (91.2%, a difference of 0.030%).
| Demographics | Rating | Rank | 12th Grade, No Diploma |
| Immigrants | Asia | 61.5 /100 | #163 | Good 91.3% |
| Immigrants | China | 60.9 /100 | #164 | Good 91.3% |
| Alsatians | 58.3 /100 | #165 | Average 91.3% |
| Hmong | 58.0 /100 | #166 | Average 91.3% |
| Immigrants | Malaysia | 57.8 /100 | #167 | Average 91.3% |
| Cree | 57.0 /100 | #168 | Average 91.2% |
| Immigrants | Indonesia | 54.9 /100 | #169 | Average 91.2% |
| Delaware | 52.8 /100 | #170 | Average 91.2% |
| Immigrants | Morocco | 51.4 /100 | #171 | Average 91.2% |
| Bermudans | 50.8 /100 | #172 | Average 91.2% |
| Bolivians | 50.4 /100 | #173 | Average 91.2% |
| Immigrants | Nepal | 50.0 /100 | #174 | Average 91.2% |
| Immigrants | Western Asia | 49.0 /100 | #175 | Average 91.2% |
| Iroquois | 48.5 /100 | #176 | Average 91.1% |
| Sierra Leoneans | 47.7 /100 | #177 | Average 91.1% |
Demographics Similar to New Zealanders by 12th Grade, No Diploma
In terms of 12th grade, no diploma, the demographic groups most similar to New Zealanders are Serbian (92.8%, a difference of 0.010%), Hungarian (92.8%, a difference of 0.010%), Welsh (92.8%, a difference of 0.010%), Immigrants from Sweden (92.8%, a difference of 0.020%), and Immigrants from Canada (92.8%, a difference of 0.030%).
| Demographics | Rating | Rank | 12th Grade, No Diploma |
| Macedonians | 99.8 /100 | #49 | Exceptional 92.9% |
| Tsimshian | 99.8 /100 | #50 | Exceptional 92.9% |
| Immigrants | Belgium | 99.8 /100 | #51 | Exceptional 92.9% |
| Immigrants | Sweden | 99.8 /100 | #52 | Exceptional 92.8% |
| Serbians | 99.7 /100 | #53 | Exceptional 92.8% |
| Hungarians | 99.7 /100 | #54 | Exceptional 92.8% |
| Welsh | 99.7 /100 | #55 | Exceptional 92.8% |
| New Zealanders | 99.7 /100 | #56 | Exceptional 92.8% |
| Immigrants | Canada | 99.7 /100 | #57 | Exceptional 92.8% |
| Immigrants | Taiwan | 99.7 /100 | #58 | Exceptional 92.8% |
| Immigrants | North America | 99.7 /100 | #59 | Exceptional 92.8% |
| Slavs | 99.7 /100 | #60 | Exceptional 92.8% |
| Immigrants | Japan | 99.7 /100 | #61 | Exceptional 92.8% |
| Ukrainians | 99.6 /100 | #62 | Exceptional 92.7% |
| Zimbabweans | 99.6 /100 | #63 | Exceptional 92.7% |