Czech vs Iraqi Unemployment Among Ages 30 to 34 years
COMPARE
Czech
Iraqi
Unemployment Among Ages 30 to 34 years
Unemployment Among Ages 30 to 34 years Comparison
Czechs
Iraqis
5.0%
UNEMPLOYMENT AMONG AGES 30 TO 34 YEARS
99.2/ 100
METRIC RATING
36th/ 347
METRIC RANK
5.2%
UNEMPLOYMENT AMONG AGES 30 TO 34 YEARS
92.6/ 100
METRIC RATING
91st/ 347
METRIC RANK
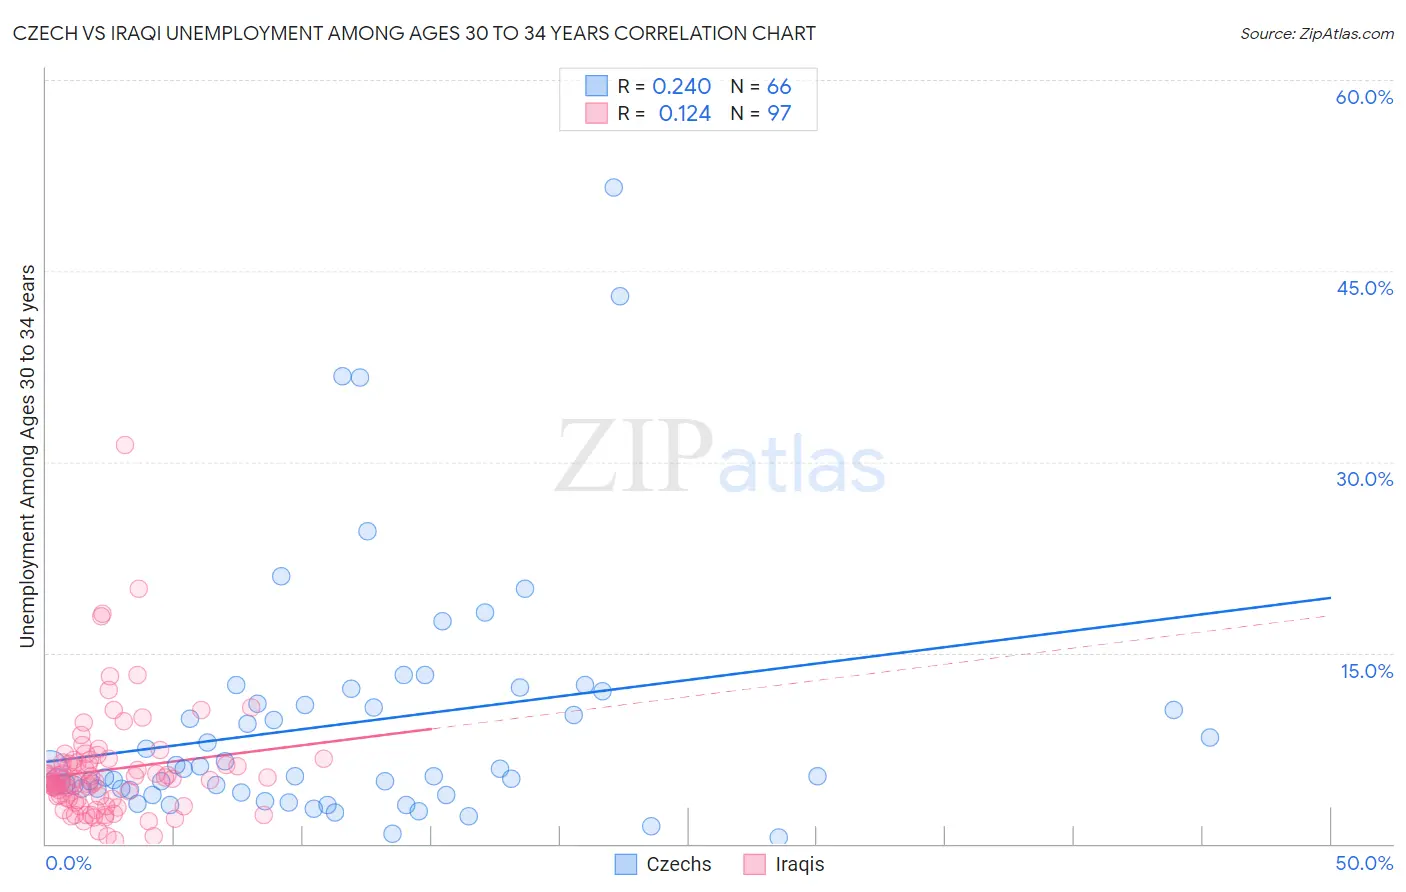
Czech vs Iraqi Unemployment Among Ages 30 to 34 years Correlation Chart
The statistical analysis conducted on geographies consisting of 438,540,719 people shows a weak positive correlation between the proportion of Czechs and unemployment rate among population between the ages 30 and 34 in the United States with a correlation coefficient (R) of 0.240 and weighted average of 5.0%. Similarly, the statistical analysis conducted on geographies consisting of 166,965,706 people shows a poor positive correlation between the proportion of Iraqis and unemployment rate among population between the ages 30 and 34 in the United States with a correlation coefficient (R) of 0.124 and weighted average of 5.2%, a difference of 4.2%.
Unemployment Among Ages 30 to 34 years Correlation Summary
| Measurement | Czech | Iraqi |
| Minimum | 0.50% | 0.30% |
| Maximum | 51.6% | 31.3% |
| Range | 51.1% | 31.0% |
| Mean | 9.5% | 5.8% |
| Median | 5.6% | 5.0% |
| Interquartile 25% (IQ1) | 4.2% | 3.5% |
| Interquartile 75% (IQ3) | 11.0% | 6.5% |
| Interquartile Range (IQR) | 6.7% | 3.0% |
| Standard Deviation (Sample) | 9.8% | 4.4% |
| Standard Deviation (Population) | 9.7% | 4.3% |
Similar Demographics by Unemployment Among Ages 30 to 34 years
Demographics Similar to Czechs by Unemployment Among Ages 30 to 34 years
In terms of unemployment among ages 30 to 34 years, the demographic groups most similar to Czechs are Immigrants from Ethiopia (5.0%, a difference of 0.040%), Immigrants from Turkey (5.0%, a difference of 0.25%), Sri Lankan (5.0%, a difference of 0.25%), Latvian (5.0%, a difference of 0.28%), and Immigrants from Saudi Arabia (5.0%, a difference of 0.32%).
| Demographics | Rating | Rank | Unemployment Among Ages 30 to 34 years |
| German Russians | 99.4 /100 | #29 | Exceptional 5.0% |
| Norwegians | 99.4 /100 | #30 | Exceptional 5.0% |
| Somalis | 99.3 /100 | #31 | Exceptional 5.0% |
| Immigrants | Zaire | 99.3 /100 | #32 | Exceptional 5.0% |
| Immigrants | Saudi Arabia | 99.3 /100 | #33 | Exceptional 5.0% |
| Latvians | 99.3 /100 | #34 | Exceptional 5.0% |
| Immigrants | Ethiopia | 99.2 /100 | #35 | Exceptional 5.0% |
| Czechs | 99.2 /100 | #36 | Exceptional 5.0% |
| Immigrants | Turkey | 99.0 /100 | #37 | Exceptional 5.0% |
| Sri Lankans | 99.0 /100 | #38 | Exceptional 5.0% |
| Fijians | 99.0 /100 | #39 | Exceptional 5.0% |
| Immigrants | Vietnam | 98.9 /100 | #40 | Exceptional 5.0% |
| Immigrants | Eastern Africa | 98.9 /100 | #41 | Exceptional 5.0% |
| Immigrants | Hong Kong | 98.8 /100 | #42 | Exceptional 5.0% |
| Soviet Union | 98.8 /100 | #43 | Exceptional 5.0% |
Demographics Similar to Iraqis by Unemployment Among Ages 30 to 34 years
In terms of unemployment among ages 30 to 34 years, the demographic groups most similar to Iraqis are Immigrants from Argentina (5.2%, a difference of 0.020%), Immigrants from Romania (5.2%, a difference of 0.050%), Laotian (5.2%, a difference of 0.070%), Maltese (5.2%, a difference of 0.070%), and Kenyan (5.2%, a difference of 0.14%).
| Demographics | Rating | Rank | Unemployment Among Ages 30 to 34 years |
| Immigrants | Uganda | 94.0 /100 | #84 | Exceptional 5.2% |
| Immigrants | Egypt | 93.9 /100 | #85 | Exceptional 5.2% |
| Immigrants | Australia | 93.5 /100 | #86 | Exceptional 5.2% |
| Bhutanese | 93.5 /100 | #87 | Exceptional 5.2% |
| Immigrants | Kenya | 93.3 /100 | #88 | Exceptional 5.2% |
| Immigrants | Sweden | 93.3 /100 | #89 | Exceptional 5.2% |
| Immigrants | Romania | 92.8 /100 | #90 | Exceptional 5.2% |
| Iraqis | 92.6 /100 | #91 | Exceptional 5.2% |
| Immigrants | Argentina | 92.5 /100 | #92 | Exceptional 5.2% |
| Laotians | 92.4 /100 | #93 | Exceptional 5.2% |
| Maltese | 92.3 /100 | #94 | Exceptional 5.2% |
| Kenyans | 92.1 /100 | #95 | Exceptional 5.2% |
| Mongolians | 91.7 /100 | #96 | Exceptional 5.2% |
| Europeans | 91.7 /100 | #97 | Exceptional 5.2% |
| Immigrants | North Macedonia | 90.9 /100 | #98 | Exceptional 5.2% |