Immigrants from Bahamas vs Iraqi Unemployment Among Ages 30 to 34 years
COMPARE
Immigrants from Bahamas
Iraqi
Unemployment Among Ages 30 to 34 years
Unemployment Among Ages 30 to 34 years Comparison
Immigrants from Bahamas
Iraqis
5.8%
UNEMPLOYMENT AMONG AGES 30 TO 34 YEARS
1.8/ 100
METRIC RATING
228th/ 347
METRIC RANK
5.2%
UNEMPLOYMENT AMONG AGES 30 TO 34 YEARS
92.6/ 100
METRIC RATING
91st/ 347
METRIC RANK
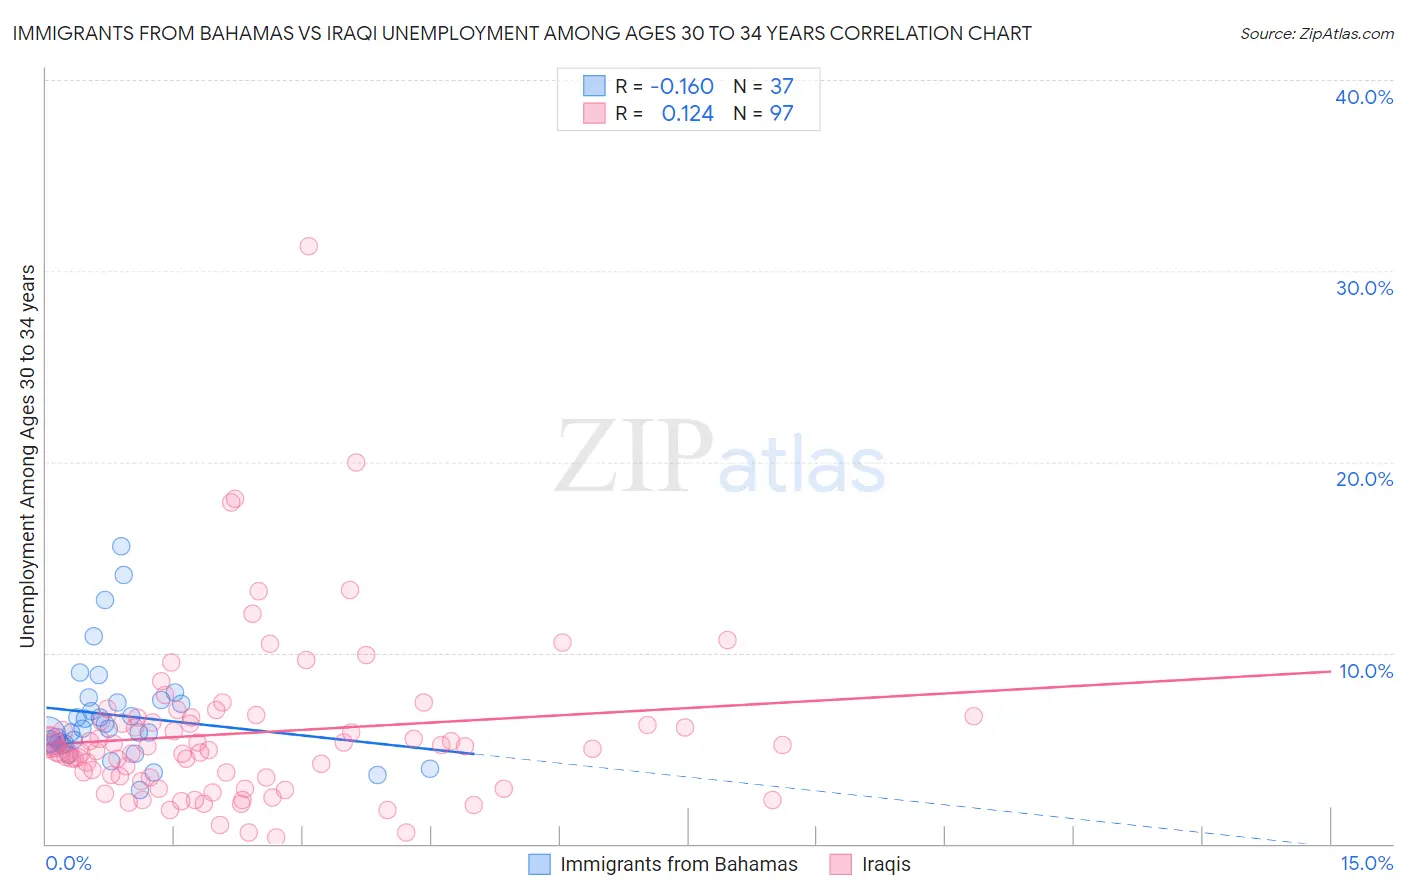
Immigrants from Bahamas vs Iraqi Unemployment Among Ages 30 to 34 years Correlation Chart
The statistical analysis conducted on geographies consisting of 102,823,903 people shows a poor negative correlation between the proportion of Immigrants from Bahamas and unemployment rate among population between the ages 30 and 34 in the United States with a correlation coefficient (R) of -0.160 and weighted average of 5.8%. Similarly, the statistical analysis conducted on geographies consisting of 166,965,706 people shows a poor positive correlation between the proportion of Iraqis and unemployment rate among population between the ages 30 and 34 in the United States with a correlation coefficient (R) of 0.124 and weighted average of 5.2%, a difference of 11.9%.
Unemployment Among Ages 30 to 34 years Correlation Summary
| Measurement | Immigrants from Bahamas | Iraqi |
| Minimum | 2.8% | 0.30% |
| Maximum | 15.6% | 31.3% |
| Range | 12.8% | 31.0% |
| Mean | 6.7% | 5.8% |
| Median | 6.0% | 5.0% |
| Interquartile 25% (IQ1) | 5.2% | 3.5% |
| Interquartile 75% (IQ3) | 7.4% | 6.5% |
| Interquartile Range (IQR) | 2.2% | 3.0% |
| Standard Deviation (Sample) | 2.8% | 4.4% |
| Standard Deviation (Population) | 2.7% | 4.3% |
Similar Demographics by Unemployment Among Ages 30 to 34 years
Demographics Similar to Immigrants from Bahamas by Unemployment Among Ages 30 to 34 years
In terms of unemployment among ages 30 to 34 years, the demographic groups most similar to Immigrants from Bahamas are Spanish (5.8%, a difference of 0.080%), Immigrants from Uzbekistan (5.9%, a difference of 0.31%), Liberian (5.8%, a difference of 0.42%), Samoan (5.8%, a difference of 0.55%), and Slovak (5.8%, a difference of 0.58%).
| Demographics | Rating | Rank | Unemployment Among Ages 30 to 34 years |
| Guamanians/Chamorros | 3.9 /100 | #221 | Tragic 5.8% |
| Spaniards | 3.2 /100 | #222 | Tragic 5.8% |
| Bermudans | 2.7 /100 | #223 | Tragic 5.8% |
| Slovaks | 2.5 /100 | #224 | Tragic 5.8% |
| Samoans | 2.5 /100 | #225 | Tragic 5.8% |
| Liberians | 2.3 /100 | #226 | Tragic 5.8% |
| Spanish | 1.8 /100 | #227 | Tragic 5.8% |
| Immigrants | Bahamas | 1.8 /100 | #228 | Tragic 5.8% |
| Immigrants | Uzbekistan | 1.5 /100 | #229 | Tragic 5.9% |
| Hawaiians | 1.2 /100 | #230 | Tragic 5.9% |
| Japanese | 1.1 /100 | #231 | Tragic 5.9% |
| Iroquois | 1.0 /100 | #232 | Tragic 5.9% |
| Nepalese | 0.8 /100 | #233 | Tragic 5.9% |
| Portuguese | 0.8 /100 | #234 | Tragic 5.9% |
| Yaqui | 0.7 /100 | #235 | Tragic 5.9% |
Demographics Similar to Iraqis by Unemployment Among Ages 30 to 34 years
In terms of unemployment among ages 30 to 34 years, the demographic groups most similar to Iraqis are Immigrants from Argentina (5.2%, a difference of 0.020%), Immigrants from Romania (5.2%, a difference of 0.050%), Laotian (5.2%, a difference of 0.070%), Maltese (5.2%, a difference of 0.070%), and Kenyan (5.2%, a difference of 0.14%).
| Demographics | Rating | Rank | Unemployment Among Ages 30 to 34 years |
| Immigrants | Uganda | 94.0 /100 | #84 | Exceptional 5.2% |
| Immigrants | Egypt | 93.9 /100 | #85 | Exceptional 5.2% |
| Immigrants | Australia | 93.5 /100 | #86 | Exceptional 5.2% |
| Bhutanese | 93.5 /100 | #87 | Exceptional 5.2% |
| Immigrants | Kenya | 93.3 /100 | #88 | Exceptional 5.2% |
| Immigrants | Sweden | 93.3 /100 | #89 | Exceptional 5.2% |
| Immigrants | Romania | 92.8 /100 | #90 | Exceptional 5.2% |
| Iraqis | 92.6 /100 | #91 | Exceptional 5.2% |
| Immigrants | Argentina | 92.5 /100 | #92 | Exceptional 5.2% |
| Laotians | 92.4 /100 | #93 | Exceptional 5.2% |
| Maltese | 92.3 /100 | #94 | Exceptional 5.2% |
| Kenyans | 92.1 /100 | #95 | Exceptional 5.2% |
| Mongolians | 91.7 /100 | #96 | Exceptional 5.2% |
| Europeans | 91.7 /100 | #97 | Exceptional 5.2% |
| Immigrants | North Macedonia | 90.9 /100 | #98 | Exceptional 5.2% |