Bangladeshi vs Immigrants from Western Europe Unemployment Among Ages 25 to 29 years
COMPARE
Bangladeshi
Immigrants from Western Europe
Unemployment Among Ages 25 to 29 years
Unemployment Among Ages 25 to 29 years Comparison
Bangladeshis
Immigrants from Western Europe
6.6%
UNEMPLOYMENT AMONG AGES 25 TO 29 YEARS
51.6/ 100
METRIC RATING
172nd/ 347
METRIC RANK
6.7%
UNEMPLOYMENT AMONG AGES 25 TO 29 YEARS
41.1/ 100
METRIC RATING
181st/ 347
METRIC RANK
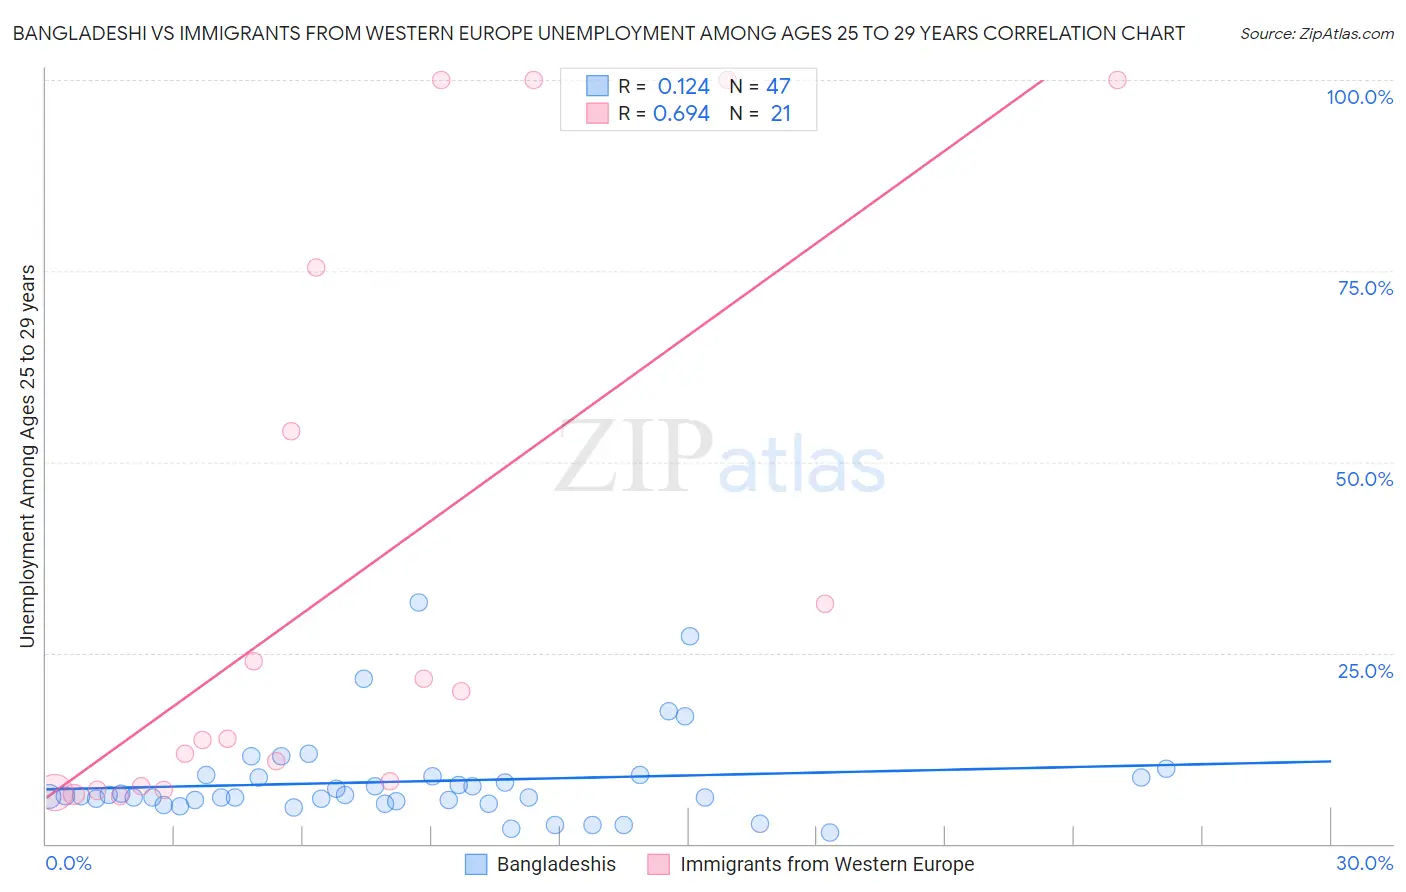
Bangladeshi vs Immigrants from Western Europe Unemployment Among Ages 25 to 29 years Correlation Chart
The statistical analysis conducted on geographies consisting of 138,536,267 people shows a poor positive correlation between the proportion of Bangladeshis and unemployment rate among population between the ages 25 and 29 in the United States with a correlation coefficient (R) of 0.124 and weighted average of 6.6%. Similarly, the statistical analysis conducted on geographies consisting of 457,284,196 people shows a significant positive correlation between the proportion of Immigrants from Western Europe and unemployment rate among population between the ages 25 and 29 in the United States with a correlation coefficient (R) of 0.694 and weighted average of 6.7%, a difference of 0.65%.
Unemployment Among Ages 25 to 29 years Correlation Summary
| Measurement | Bangladeshi | Immigrants from Western Europe |
| Minimum | 1.5% | 6.2% |
| Maximum | 31.6% | 100.0% |
| Range | 30.1% | 93.8% |
| Mean | 8.2% | 34.5% |
| Median | 6.2% | 13.8% |
| Interquartile 25% (IQ1) | 5.6% | 7.3% |
| Interquartile 75% (IQ3) | 8.8% | 64.7% |
| Interquartile Range (IQR) | 3.3% | 57.4% |
| Standard Deviation (Sample) | 5.9% | 36.7% |
| Standard Deviation (Population) | 5.9% | 35.8% |
Demographics Similar to Bangladeshis and Immigrants from Western Europe by Unemployment Among Ages 25 to 29 years
In terms of unemployment among ages 25 to 29 years, the demographic groups most similar to Bangladeshis are Russian (6.6%, a difference of 0.020%), Immigrants from Cambodia (6.6%, a difference of 0.060%), Immigrants from North America (6.6%, a difference of 0.10%), Albanian (6.6%, a difference of 0.12%), and Immigrants from South Eastern Asia (6.7%, a difference of 0.15%). Similarly, the demographic groups most similar to Immigrants from Western Europe are Immigrants from Africa (6.7%, a difference of 0.0%), Czechoslovakian (6.7%, a difference of 0.020%), Immigrants from Scotland (6.7%, a difference of 0.090%), Immigrants from Costa Rica (6.7%, a difference of 0.18%), and Costa Rican (6.7%, a difference of 0.24%).
| Demographics | Rating | Rank | Unemployment Among Ages 25 to 29 years |
| Immigrants | Northern Europe | 57.3 /100 | #166 | Average 6.6% |
| Immigrants | Canada | 55.0 /100 | #167 | Average 6.6% |
| Estonians | 54.8 /100 | #168 | Average 6.6% |
| South Americans | 54.5 /100 | #169 | Average 6.6% |
| Albanians | 53.5 /100 | #170 | Average 6.6% |
| Immigrants | Cambodia | 52.6 /100 | #171 | Average 6.6% |
| Bangladeshis | 51.6 /100 | #172 | Average 6.6% |
| Russians | 51.3 /100 | #173 | Average 6.6% |
| Immigrants | North America | 50.0 /100 | #174 | Average 6.6% |
| Immigrants | South Eastern Asia | 49.1 /100 | #175 | Average 6.7% |
| Osage | 48.1 /100 | #176 | Average 6.7% |
| Immigrants | Israel | 47.8 /100 | #177 | Average 6.7% |
| Immigrants | Iraq | 45.1 /100 | #178 | Average 6.7% |
| Costa Ricans | 44.9 /100 | #179 | Average 6.7% |
| Immigrants | Africa | 41.1 /100 | #180 | Average 6.7% |
| Immigrants | Western Europe | 41.1 /100 | #181 | Average 6.7% |
| Czechoslovakians | 40.7 /100 | #182 | Average 6.7% |
| Immigrants | Scotland | 39.6 /100 | #183 | Fair 6.7% |
| Immigrants | Costa Rica | 38.3 /100 | #184 | Fair 6.7% |
| Moroccans | 35.9 /100 | #185 | Fair 6.7% |
| Immigrants | Iran | 34.4 /100 | #186 | Fair 6.7% |