Cuban vs Immigrants from Korea Unemployment Among Ages 60 to 64 years
COMPARE
Cuban
Immigrants from Korea
Unemployment Among Ages 60 to 64 years
Unemployment Among Ages 60 to 64 years Comparison
Cubans
Immigrants from Korea
4.5%
UNEMPLOYMENT AMONG AGES 60 TO 64 YEARS
100.0/ 100
METRIC RATING
29th/ 347
METRIC RANK
4.8%
UNEMPLOYMENT AMONG AGES 60 TO 64 YEARS
54.2/ 100
METRIC RATING
170th/ 347
METRIC RANK
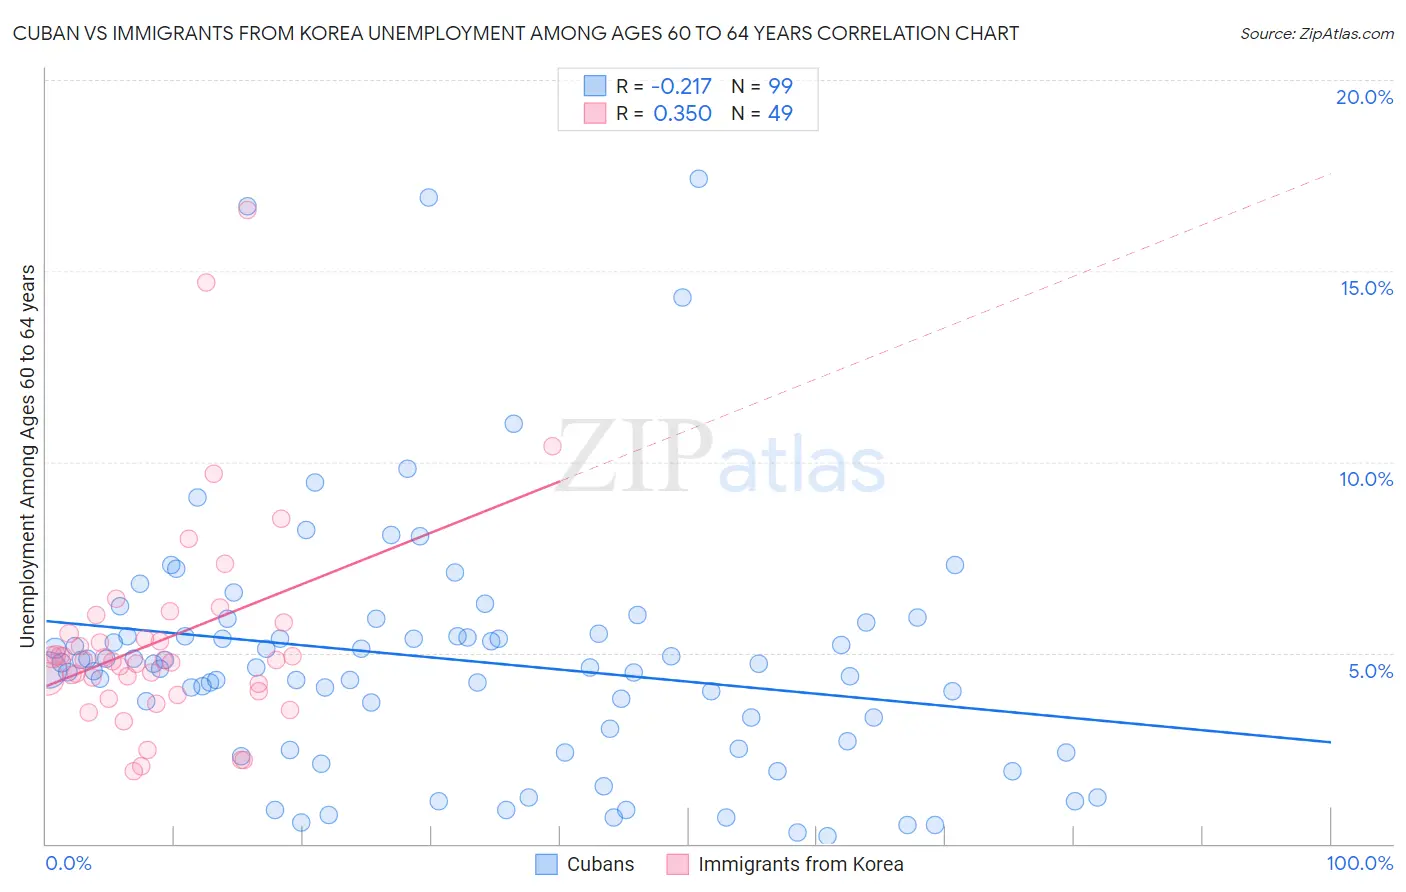
Cuban vs Immigrants from Korea Unemployment Among Ages 60 to 64 years Correlation Chart
The statistical analysis conducted on geographies consisting of 400,465,537 people shows a weak negative correlation between the proportion of Cubans and unemployment rate among population between the ages 60 and 64 in the United States with a correlation coefficient (R) of -0.217 and weighted average of 4.5%. Similarly, the statistical analysis conducted on geographies consisting of 374,603,852 people shows a mild positive correlation between the proportion of Immigrants from Korea and unemployment rate among population between the ages 60 and 64 in the United States with a correlation coefficient (R) of 0.350 and weighted average of 4.8%, a difference of 8.6%.
Unemployment Among Ages 60 to 64 years Correlation Summary
| Measurement | Cuban | Immigrants from Korea |
| Minimum | 0.20% | 1.9% |
| Maximum | 17.4% | 16.6% |
| Range | 17.2% | 14.7% |
| Mean | 4.8% | 5.3% |
| Median | 4.6% | 4.8% |
| Interquartile 25% (IQ1) | 2.7% | 4.1% |
| Interquartile 75% (IQ3) | 5.5% | 5.7% |
| Interquartile Range (IQR) | 2.8% | 1.6% |
| Standard Deviation (Sample) | 3.3% | 2.8% |
| Standard Deviation (Population) | 3.3% | 2.7% |
Similar Demographics by Unemployment Among Ages 60 to 64 years
Demographics Similar to Cubans by Unemployment Among Ages 60 to 64 years
In terms of unemployment among ages 60 to 64 years, the demographic groups most similar to Cubans are Immigrants from Venezuela (4.5%, a difference of 0.020%), Immigrants from Eritrea (4.5%, a difference of 0.090%), Zimbabwean (4.5%, a difference of 0.13%), Carpatho Rusyn (4.5%, a difference of 0.18%), and Immigrants from Nepal (4.5%, a difference of 0.23%).
| Demographics | Rating | Rank | Unemployment Among Ages 60 to 64 years |
| Cape Verdeans | 100.0 /100 | #22 | Exceptional 4.4% |
| Immigrants | Zaire | 100.0 /100 | #23 | Exceptional 4.4% |
| Immigrants | Burma/Myanmar | 100.0 /100 | #24 | Exceptional 4.4% |
| Yugoslavians | 100.0 /100 | #25 | Exceptional 4.4% |
| Czechs | 100.0 /100 | #26 | Exceptional 4.4% |
| Immigrants | Iraq | 100.0 /100 | #27 | Exceptional 4.5% |
| Immigrants | Nepal | 100.0 /100 | #28 | Exceptional 4.5% |
| Cubans | 100.0 /100 | #29 | Exceptional 4.5% |
| Immigrants | Venezuela | 100.0 /100 | #30 | Exceptional 4.5% |
| Immigrants | Eritrea | 100.0 /100 | #31 | Exceptional 4.5% |
| Zimbabweans | 100.0 /100 | #32 | Exceptional 4.5% |
| Carpatho Rusyns | 100.0 /100 | #33 | Exceptional 4.5% |
| Belgians | 100.0 /100 | #34 | Exceptional 4.5% |
| Germans | 100.0 /100 | #35 | Exceptional 4.5% |
| Venezuelans | 100.0 /100 | #36 | Exceptional 4.5% |
Demographics Similar to Immigrants from Korea by Unemployment Among Ages 60 to 64 years
In terms of unemployment among ages 60 to 64 years, the demographic groups most similar to Immigrants from Korea are Samoan (4.9%, a difference of 0.020%), Immigrants from France (4.8%, a difference of 0.050%), Immigrants from Turkey (4.9%, a difference of 0.050%), Immigrants from Southern Europe (4.8%, a difference of 0.090%), and Immigrants from Hungary (4.9%, a difference of 0.14%).
| Demographics | Rating | Rank | Unemployment Among Ages 60 to 64 years |
| Immigrants | Belgium | 64.8 /100 | #163 | Good 4.8% |
| Pakistanis | 64.6 /100 | #164 | Good 4.8% |
| Immigrants | Panama | 62.0 /100 | #165 | Good 4.8% |
| Palestinians | 60.5 /100 | #166 | Good 4.8% |
| Immigrants | Northern Europe | 59.1 /100 | #167 | Average 4.8% |
| Immigrants | Southern Europe | 56.7 /100 | #168 | Average 4.8% |
| Immigrants | France | 55.5 /100 | #169 | Average 4.8% |
| Immigrants | Korea | 54.2 /100 | #170 | Average 4.8% |
| Samoans | 53.6 /100 | #171 | Average 4.9% |
| Immigrants | Turkey | 52.8 /100 | #172 | Average 4.9% |
| Immigrants | Hungary | 50.2 /100 | #173 | Average 4.9% |
| Immigrants | Western Europe | 50.0 /100 | #174 | Average 4.9% |
| Immigrants | Latvia | 46.9 /100 | #175 | Average 4.9% |
| Bermudans | 46.5 /100 | #176 | Average 4.9% |
| Immigrants | Malaysia | 44.7 /100 | #177 | Average 4.9% |