Crow vs Immigrants from Belgium Unemployment Among Ages 65 to 74 years
COMPARE
Crow
Immigrants from Belgium
Unemployment Among Ages 65 to 74 years
Unemployment Among Ages 65 to 74 years Comparison
Crow
Immigrants from Belgium
17.4%
UNEMPLOYMENT AMONG AGES 65 TO 74 YEARS
0.0/ 100
METRIC RATING
347th/ 347
METRIC RANK
5.4%
UNEMPLOYMENT AMONG AGES 65 TO 74 YEARS
16.2/ 100
METRIC RATING
199th/ 347
METRIC RANK
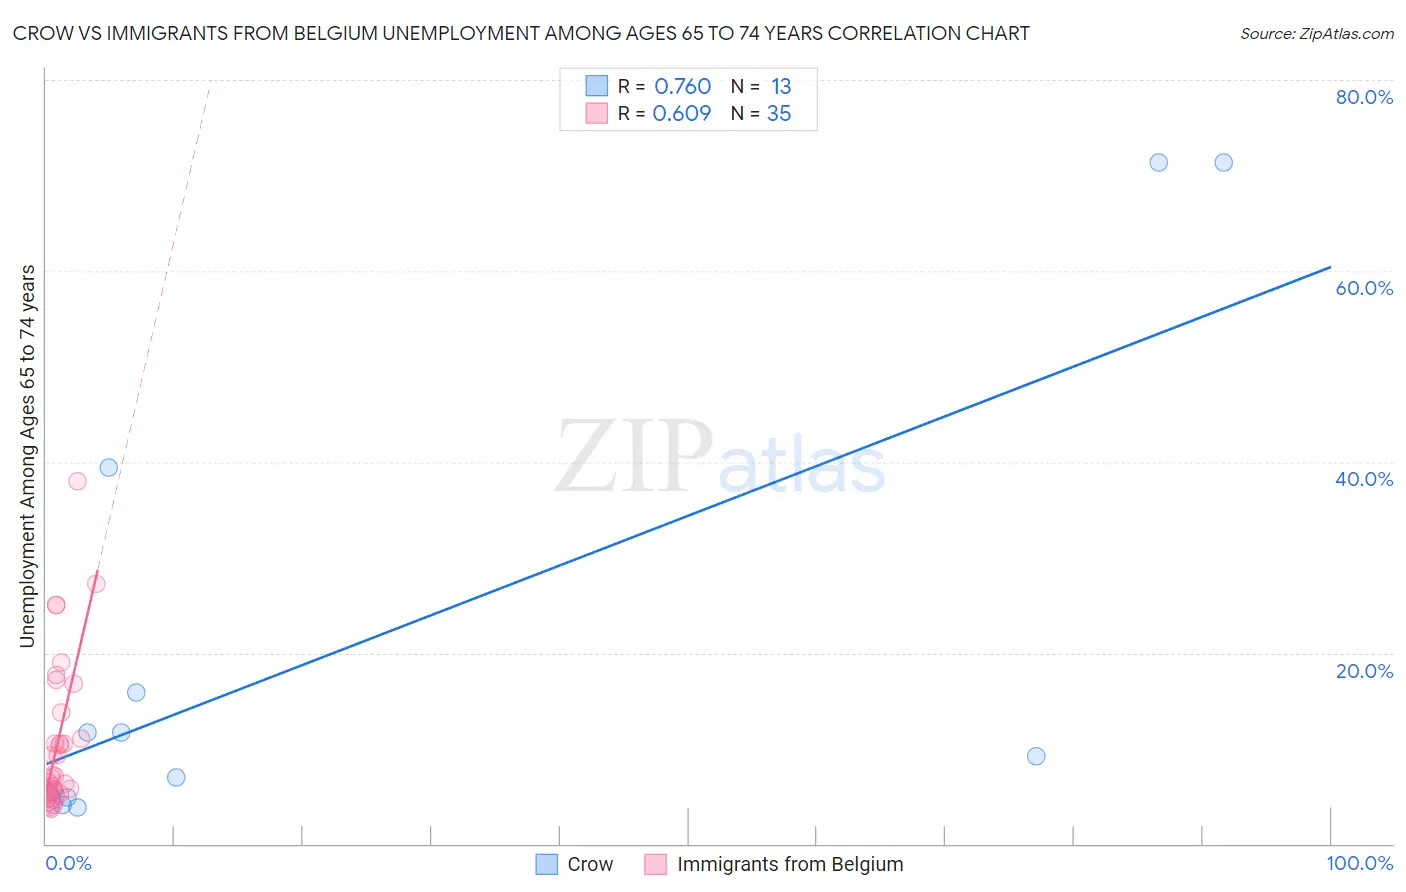
Crow vs Immigrants from Belgium Unemployment Among Ages 65 to 74 years Correlation Chart
The statistical analysis conducted on geographies consisting of 55,742,978 people shows a strong positive correlation between the proportion of Crow and unemployment rate among population between the ages 65 and 74 in the United States with a correlation coefficient (R) of 0.760 and weighted average of 17.4%. Similarly, the statistical analysis conducted on geographies consisting of 139,238,535 people shows a significant positive correlation between the proportion of Immigrants from Belgium and unemployment rate among population between the ages 65 and 74 in the United States with a correlation coefficient (R) of 0.609 and weighted average of 5.4%, a difference of 220.0%.
Unemployment Among Ages 65 to 74 years Correlation Summary
| Measurement | Crow | Immigrants from Belgium |
| Minimum | 3.9% | 3.7% |
| Maximum | 71.4% | 38.0% |
| Range | 67.5% | 34.3% |
| Mean | 20.0% | 10.7% |
| Median | 9.1% | 7.1% |
| Interquartile 25% (IQ1) | 4.8% | 5.3% |
| Interquartile 75% (IQ3) | 27.6% | 13.8% |
| Interquartile Range (IQR) | 22.8% | 8.5% |
| Standard Deviation (Sample) | 24.6% | 8.0% |
| Standard Deviation (Population) | 23.7% | 7.9% |
Similar Demographics by Unemployment Among Ages 65 to 74 years
Demographics Similar to Crow by Unemployment Among Ages 65 to 74 years
In terms of unemployment among ages 65 to 74 years, the demographic groups most similar to Crow are Yup'ik (9.5%, a difference of 84.0%), Immigrants from Yemen (8.3%, a difference of 110.8%), Inupiat (7.5%, a difference of 132.3%), Alaskan Athabascan (7.4%, a difference of 136.7%), and Navajo (6.9%, a difference of 151.3%).
| Demographics | Rating | Rank | Unemployment Among Ages 65 to 74 years |
| Paiute | 0.0 /100 | #333 | Tragic 6.3% |
| Taiwanese | 0.0 /100 | #334 | Tragic 6.3% |
| Puerto Ricans | 0.0 /100 | #335 | Tragic 6.4% |
| Immigrants | Armenia | 0.0 /100 | #336 | Tragic 6.5% |
| Ute | 0.0 /100 | #337 | Tragic 6.5% |
| Tlingit-Haida | 0.0 /100 | #338 | Tragic 6.5% |
| Yakama | 0.0 /100 | #339 | Tragic 6.6% |
| Pima | 0.0 /100 | #340 | Tragic 6.6% |
| Alaska Natives | 0.0 /100 | #341 | Tragic 6.8% |
| Navajo | 0.0 /100 | #342 | Tragic 6.9% |
| Alaskan Athabascans | 0.0 /100 | #343 | Tragic 7.4% |
| Inupiat | 0.0 /100 | #344 | Tragic 7.5% |
| Immigrants | Yemen | 0.0 /100 | #345 | Tragic 8.3% |
| Yup'ik | 0.0 /100 | #346 | Tragic 9.5% |
| Crow | 0.0 /100 | #347 | Tragic 17.4% |
Demographics Similar to Immigrants from Belgium by Unemployment Among Ages 65 to 74 years
In terms of unemployment among ages 65 to 74 years, the demographic groups most similar to Immigrants from Belgium are Immigrants from Pakistan (5.4%, a difference of 0.060%), Immigrants from Western Asia (5.4%, a difference of 0.080%), Albanian (5.4%, a difference of 0.10%), Subsaharan African (5.4%, a difference of 0.12%), and Argentinean (5.4%, a difference of 0.12%).
| Demographics | Rating | Rank | Unemployment Among Ages 65 to 74 years |
| Maltese | 26.4 /100 | #192 | Fair 5.4% |
| Cherokee | 25.8 /100 | #193 | Fair 5.4% |
| Immigrants | Denmark | 24.7 /100 | #194 | Fair 5.4% |
| Immigrants | China | 24.2 /100 | #195 | Fair 5.4% |
| Costa Ricans | 21.1 /100 | #196 | Fair 5.4% |
| Colville | 20.4 /100 | #197 | Fair 5.4% |
| Albanians | 17.8 /100 | #198 | Poor 5.4% |
| Immigrants | Belgium | 16.2 /100 | #199 | Poor 5.4% |
| Immigrants | Pakistan | 15.2 /100 | #200 | Poor 5.4% |
| Immigrants | Western Asia | 14.9 /100 | #201 | Poor 5.4% |
| Sub-Saharan Africans | 14.4 /100 | #202 | Poor 5.4% |
| Argentineans | 14.3 /100 | #203 | Poor 5.4% |
| Seminole | 14.3 /100 | #204 | Poor 5.4% |
| Icelanders | 14.2 /100 | #205 | Poor 5.4% |
| Africans | 12.8 /100 | #206 | Poor 5.5% |