Croatian vs Scotch-Irish Unemployment Among Ages 65 to 74 years
COMPARE
Croatian
Scotch-Irish
Unemployment Among Ages 65 to 74 years
Unemployment Among Ages 65 to 74 years Comparison
Croatians
Scotch-Irish
5.1%
UNEMPLOYMENT AMONG AGES 65 TO 74 YEARS
99.5/ 100
METRIC RATING
57th/ 347
METRIC RANK
5.2%
UNEMPLOYMENT AMONG AGES 65 TO 74 YEARS
99.0/ 100
METRIC RATING
71st/ 347
METRIC RANK
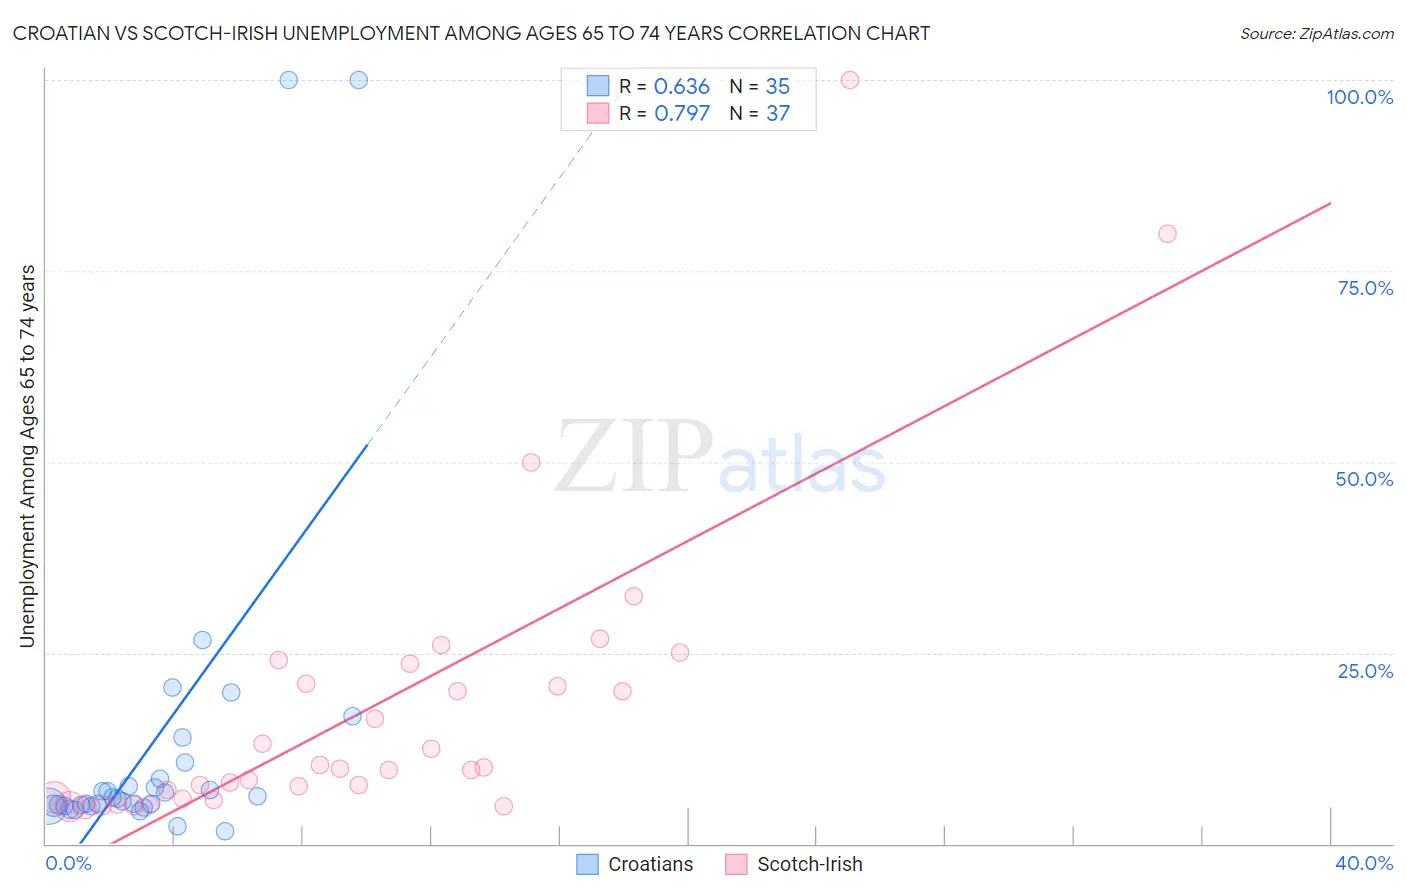
Croatian vs Scotch-Irish Unemployment Among Ages 65 to 74 years Correlation Chart
The statistical analysis conducted on geographies consisting of 329,855,198 people shows a significant positive correlation between the proportion of Croatians and unemployment rate among population between the ages 65 and 74 in the United States with a correlation coefficient (R) of 0.636 and weighted average of 5.1%. Similarly, the statistical analysis conducted on geographies consisting of 431,743,679 people shows a strong positive correlation between the proportion of Scotch-Irish and unemployment rate among population between the ages 65 and 74 in the United States with a correlation coefficient (R) of 0.797 and weighted average of 5.2%, a difference of 0.61%.
Unemployment Among Ages 65 to 74 years Correlation Summary
| Measurement | Croatian | Scotch-Irish |
| Minimum | 1.6% | 4.7% |
| Maximum | 100.0% | 100.0% |
| Range | 98.4% | 95.3% |
| Mean | 13.0% | 17.8% |
| Median | 5.8% | 9.8% |
| Interquartile 25% (IQ1) | 5.0% | 6.0% |
| Interquartile 75% (IQ3) | 8.5% | 22.2% |
| Interquartile Range (IQR) | 3.5% | 16.3% |
| Standard Deviation (Sample) | 22.4% | 20.2% |
| Standard Deviation (Population) | 22.1% | 19.9% |
Demographics Similar to Croatians and Scotch-Irish by Unemployment Among Ages 65 to 74 years
In terms of unemployment among ages 65 to 74 years, the demographic groups most similar to Croatians are Swedish (5.1%, a difference of 0.0%), German (5.1%, a difference of 0.050%), Carpatho Rusyn (5.1%, a difference of 0.080%), Immigrants from Bulgaria (5.1%, a difference of 0.10%), and Immigrants from Jordan (5.1%, a difference of 0.15%). Similarly, the demographic groups most similar to Scotch-Irish are Immigrants from Oceania (5.2%, a difference of 0.010%), Filipino (5.2%, a difference of 0.030%), Afghan (5.2%, a difference of 0.040%), Immigrants from Japan (5.2%, a difference of 0.11%), and Scandinavian (5.2%, a difference of 0.13%).
| Demographics | Rating | Rank | Unemployment Among Ages 65 to 74 years |
| Immigrants | Nicaragua | 99.6 /100 | #54 | Exceptional 5.1% |
| Carpatho Rusyns | 99.6 /100 | #55 | Exceptional 5.1% |
| Swedes | 99.5 /100 | #56 | Exceptional 5.1% |
| Croatians | 99.5 /100 | #57 | Exceptional 5.1% |
| Germans | 99.5 /100 | #58 | Exceptional 5.1% |
| Immigrants | Bulgaria | 99.4 /100 | #59 | Exceptional 5.1% |
| Immigrants | Jordan | 99.4 /100 | #60 | Exceptional 5.1% |
| Immigrants | Taiwan | 99.4 /100 | #61 | Exceptional 5.1% |
| Nicaraguans | 99.4 /100 | #62 | Exceptional 5.1% |
| Kiowa | 99.3 /100 | #63 | Exceptional 5.1% |
| Immigrants | Moldova | 99.3 /100 | #64 | Exceptional 5.1% |
| Bolivians | 99.3 /100 | #65 | Exceptional 5.1% |
| Iroquois | 99.3 /100 | #66 | Exceptional 5.1% |
| Swiss | 99.2 /100 | #67 | Exceptional 5.1% |
| Latvians | 99.2 /100 | #68 | Exceptional 5.1% |
| Scandinavians | 99.1 /100 | #69 | Exceptional 5.2% |
| Immigrants | Japan | 99.1 /100 | #70 | Exceptional 5.2% |
| Scotch-Irish | 99.0 /100 | #71 | Exceptional 5.2% |
| Immigrants | Oceania | 99.0 /100 | #72 | Exceptional 5.2% |
| Filipinos | 99.0 /100 | #73 | Exceptional 5.2% |
| Afghans | 99.0 /100 | #74 | Exceptional 5.2% |