Blackfeet vs Immigrants from Caribbean Unemployment Among Women with Children Under 18 years
COMPARE
Blackfeet
Immigrants from Caribbean
Unemployment Among Women with Children Under 18 years
Unemployment Among Women with Children Under 18 years Comparison
Blackfeet
Immigrants from Caribbean
6.4%
UNEMPLOYMENT AMONG WOMEN WITH CHILDREN UNDER 18 YEARS
0.0/ 100
METRIC RATING
290th/ 347
METRIC RANK
6.4%
UNEMPLOYMENT AMONG WOMEN WITH CHILDREN UNDER 18 YEARS
0.0/ 100
METRIC RATING
289th/ 347
METRIC RANK
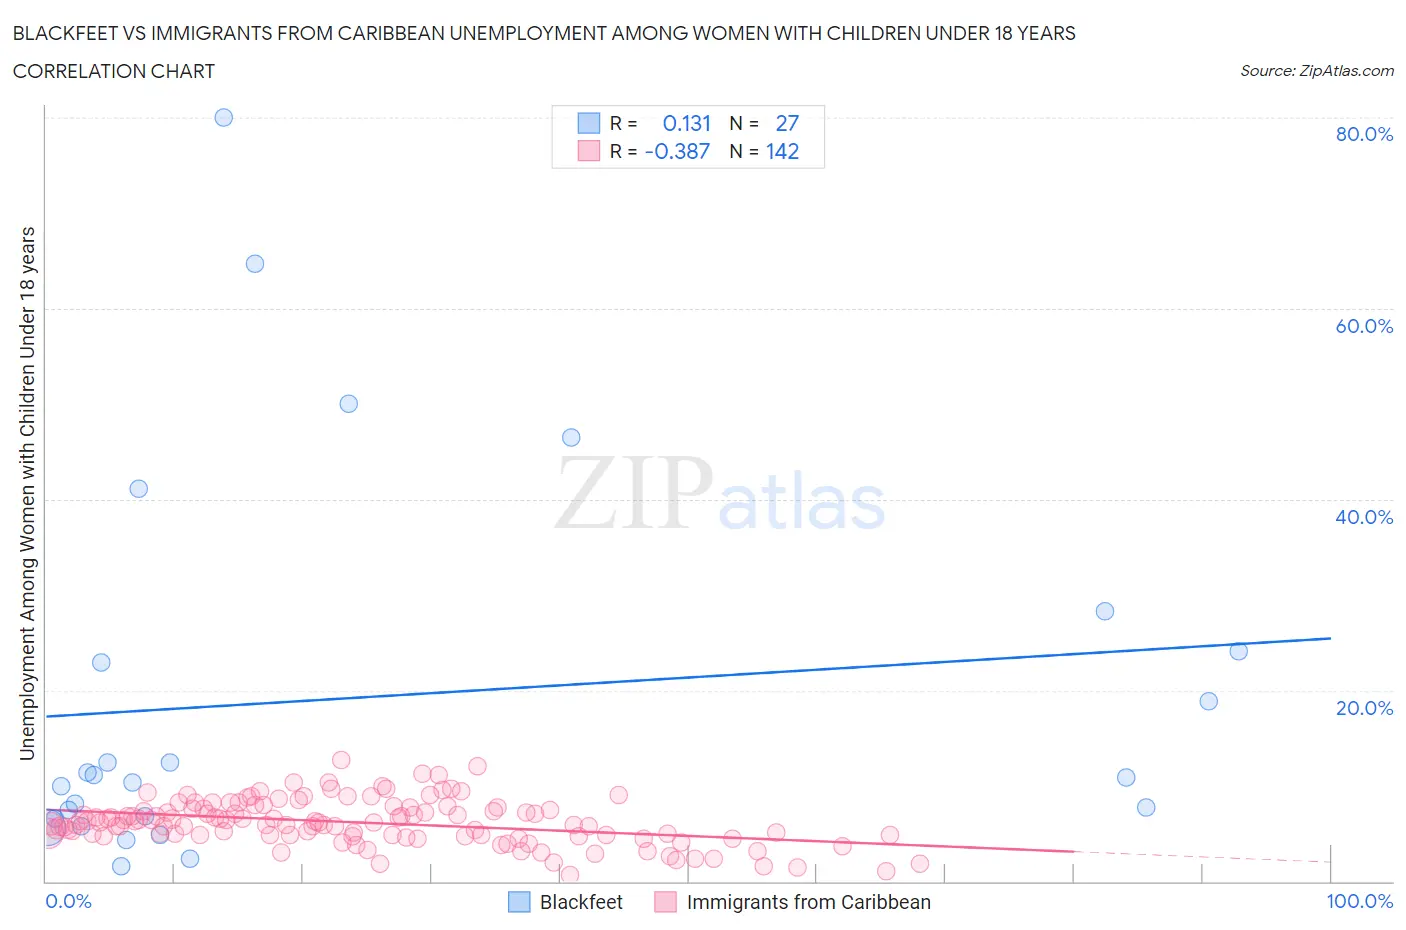
Blackfeet vs Immigrants from Caribbean Unemployment Among Women with Children Under 18 years Correlation Chart
The statistical analysis conducted on geographies consisting of 298,774,104 people shows a poor positive correlation between the proportion of Blackfeet and unemployment rate among women with children under the age of 18 in the United States with a correlation coefficient (R) of 0.131 and weighted average of 6.4%. Similarly, the statistical analysis conducted on geographies consisting of 429,431,421 people shows a mild negative correlation between the proportion of Immigrants from Caribbean and unemployment rate among women with children under the age of 18 in the United States with a correlation coefficient (R) of -0.387 and weighted average of 6.4%, a difference of 0.040%.
Unemployment Among Women with Children Under 18 years Correlation Summary
| Measurement | Blackfeet | Immigrants from Caribbean |
| Minimum | 1.6% | 0.70% |
| Maximum | 80.0% | 12.7% |
| Range | 78.4% | 12.0% |
| Mean | 19.1% | 6.2% |
| Median | 10.9% | 6.1% |
| Interquartile 25% (IQ1) | 6.5% | 4.8% |
| Interquartile 75% (IQ3) | 24.1% | 7.6% |
| Interquartile Range (IQR) | 17.6% | 2.8% |
| Standard Deviation (Sample) | 20.2% | 2.3% |
| Standard Deviation (Population) | 19.8% | 2.3% |
Demographics Similar to Blackfeet and Immigrants from Caribbean by Unemployment Among Women with Children Under 18 years
In terms of unemployment among women with children under 18 years, the demographic groups most similar to Blackfeet are Immigrants from Guatemala (6.4%, a difference of 0.13%), Mexican (6.4%, a difference of 0.18%), Immigrants from Bangladesh (6.4%, a difference of 0.21%), Honduran (6.4%, a difference of 0.24%), and Barbadian (6.4%, a difference of 0.32%). Similarly, the demographic groups most similar to Immigrants from Caribbean are Immigrants from Guatemala (6.4%, a difference of 0.17%), Mexican (6.4%, a difference of 0.22%), Immigrants from Bangladesh (6.4%, a difference of 0.25%), Honduran (6.4%, a difference of 0.28%), and Cree (6.3%, a difference of 0.36%).
| Demographics | Rating | Rank | Unemployment Among Women with Children Under 18 years |
| Immigrants | Portugal | 0.0 /100 | #279 | Tragic 6.3% |
| Guatemalans | 0.0 /100 | #280 | Tragic 6.3% |
| Immigrants | El Salvador | 0.0 /100 | #281 | Tragic 6.3% |
| Immigrants | St. Vincent and the Grenadines | 0.0 /100 | #282 | Tragic 6.3% |
| West Indians | 0.0 /100 | #283 | Tragic 6.3% |
| Immigrants | Grenada | 0.0 /100 | #284 | Tragic 6.3% |
| Bahamians | 0.0 /100 | #285 | Tragic 6.3% |
| Alaskan Athabascans | 0.0 /100 | #286 | Tragic 6.3% |
| Kiowa | 0.0 /100 | #287 | Tragic 6.3% |
| Cree | 0.0 /100 | #288 | Tragic 6.3% |
| Immigrants | Caribbean | 0.0 /100 | #289 | Tragic 6.4% |
| Blackfeet | 0.0 /100 | #290 | Tragic 6.4% |
| Immigrants | Guatemala | 0.0 /100 | #291 | Tragic 6.4% |
| Mexicans | 0.0 /100 | #292 | Tragic 6.4% |
| Immigrants | Bangladesh | 0.0 /100 | #293 | Tragic 6.4% |
| Hondurans | 0.0 /100 | #294 | Tragic 6.4% |
| Barbadians | 0.0 /100 | #295 | Tragic 6.4% |
| Haitians | 0.0 /100 | #296 | Tragic 6.4% |
| Immigrants | Senegal | 0.0 /100 | #297 | Tragic 6.4% |
| Immigrants | Latin America | 0.0 /100 | #298 | Tragic 6.4% |
| Jamaicans | 0.0 /100 | #299 | Tragic 6.4% |