Cree vs Immigrants from Argentina Unemployment
COMPARE
Cree
Immigrants from Argentina
Unemployment
Unemployment Comparison
Cree
Immigrants from Argentina
5.6%
UNEMPLOYMENT
2.6/ 100
METRIC RATING
240th/ 347
METRIC RANK
5.0%
UNEMPLOYMENT
94.1/ 100
METRIC RATING
102nd/ 347
METRIC RANK
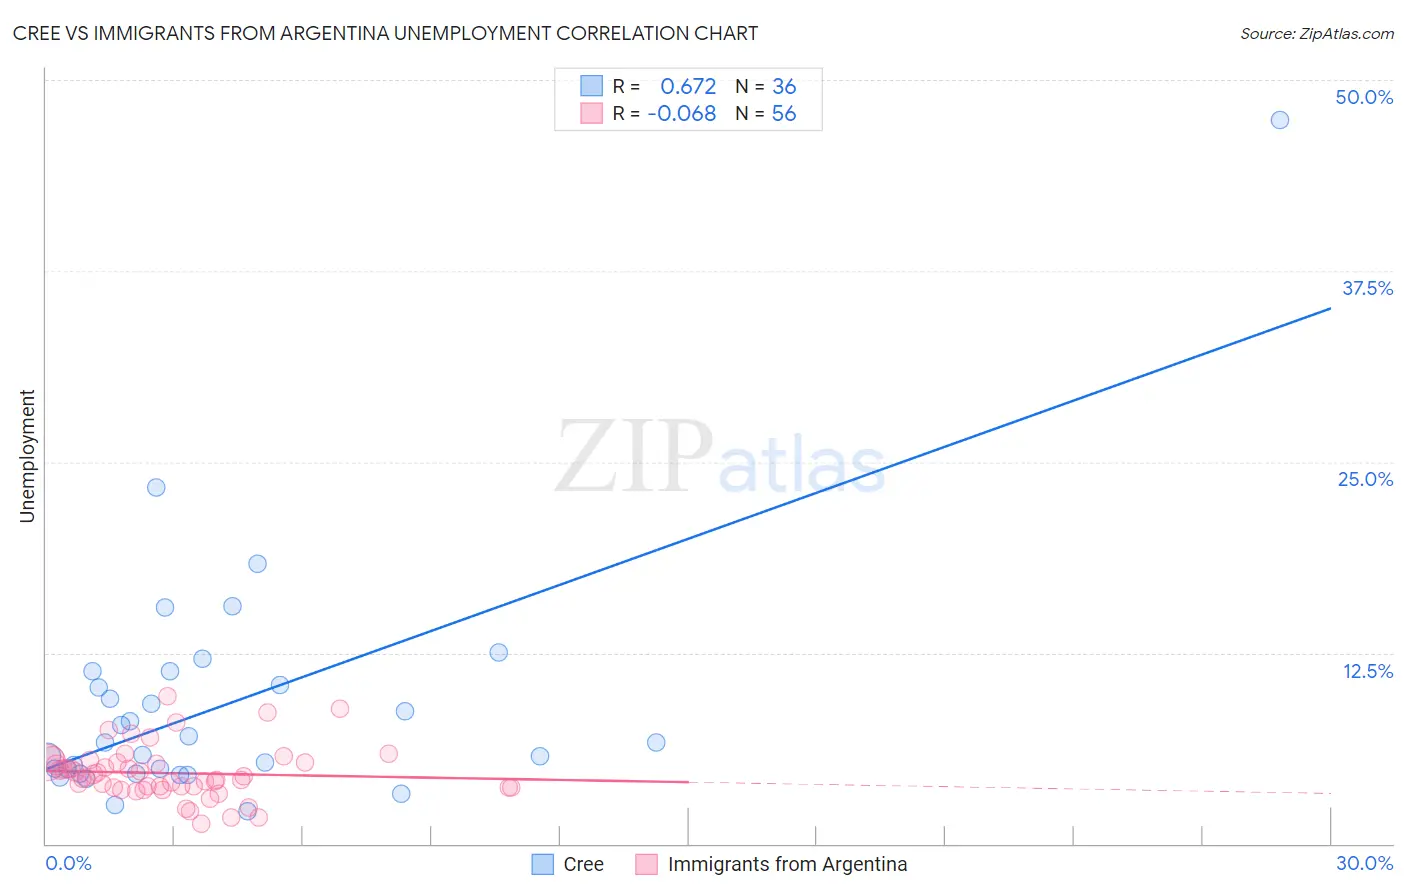
Cree vs Immigrants from Argentina Unemployment Correlation Chart
The statistical analysis conducted on geographies consisting of 76,166,078 people shows a significant positive correlation between the proportion of Cree and unemployment in the United States with a correlation coefficient (R) of 0.672 and weighted average of 5.6%. Similarly, the statistical analysis conducted on geographies consisting of 264,363,523 people shows a slight negative correlation between the proportion of Immigrants from Argentina and unemployment in the United States with a correlation coefficient (R) of -0.068 and weighted average of 5.0%, a difference of 10.3%.
Unemployment Correlation Summary
| Measurement | Cree | Immigrants from Argentina |
| Minimum | 2.1% | 1.3% |
| Maximum | 47.4% | 9.7% |
| Range | 45.3% | 8.4% |
| Mean | 9.1% | 4.6% |
| Median | 6.6% | 4.4% |
| Interquartile 25% (IQ1) | 4.7% | 3.7% |
| Interquartile 75% (IQ3) | 10.8% | 5.3% |
| Interquartile Range (IQR) | 6.1% | 1.6% |
| Standard Deviation (Sample) | 8.0% | 1.7% |
| Standard Deviation (Population) | 7.9% | 1.7% |
Similar Demographics by Unemployment
Demographics Similar to Cree by Unemployment
In terms of unemployment, the demographic groups most similar to Cree are Immigrants (5.5%, a difference of 0.010%), Immigrants from Western Asia (5.5%, a difference of 0.10%), Moroccan (5.5%, a difference of 0.31%), Tlingit-Haida (5.6%, a difference of 0.34%), and Spanish American (5.6%, a difference of 0.35%).
| Demographics | Rating | Rank | Unemployment |
| Immigrants | Syria | 4.8 /100 | #233 | Tragic 5.5% |
| Panamanians | 4.7 /100 | #234 | Tragic 5.5% |
| Immigrants | Panama | 3.4 /100 | #235 | Tragic 5.5% |
| Immigrants | Cambodia | 3.3 /100 | #236 | Tragic 5.5% |
| Moroccans | 3.2 /100 | #237 | Tragic 5.5% |
| Immigrants | Western Asia | 2.8 /100 | #238 | Tragic 5.5% |
| Immigrants | Immigrants | 2.6 /100 | #239 | Tragic 5.5% |
| Cree | 2.6 /100 | #240 | Tragic 5.6% |
| Tlingit-Haida | 2.0 /100 | #241 | Tragic 5.6% |
| Spanish Americans | 2.0 /100 | #242 | Tragic 5.6% |
| Marshallese | 1.3 /100 | #243 | Tragic 5.6% |
| Dutch West Indians | 1.2 /100 | #244 | Tragic 5.6% |
| French American Indians | 1.2 /100 | #245 | Tragic 5.6% |
| Bermudans | 1.1 /100 | #246 | Tragic 5.6% |
| Immigrants | Cameroon | 1.0 /100 | #247 | Tragic 5.6% |
Demographics Similar to Immigrants from Argentina by Unemployment
In terms of unemployment, the demographic groups most similar to Immigrants from Argentina are Chickasaw (5.0%, a difference of 0.040%), Osage (5.0%, a difference of 0.040%), Maltese (5.0%, a difference of 0.040%), American (5.0%, a difference of 0.050%), and Immigrants from Romania (5.0%, a difference of 0.11%).
| Demographics | Rating | Rank | Unemployment |
| Immigrants | Serbia | 95.6 /100 | #95 | Exceptional 5.0% |
| Immigrants | England | 95.2 /100 | #96 | Exceptional 5.0% |
| Immigrants | Czechoslovakia | 95.1 /100 | #97 | Exceptional 5.0% |
| Romanians | 95.0 /100 | #98 | Exceptional 5.0% |
| Mongolians | 94.8 /100 | #99 | Exceptional 5.0% |
| Estonians | 94.6 /100 | #100 | Exceptional 5.0% |
| Americans | 94.3 /100 | #101 | Exceptional 5.0% |
| Immigrants | Argentina | 94.1 /100 | #102 | Exceptional 5.0% |
| Chickasaw | 94.0 /100 | #103 | Exceptional 5.0% |
| Osage | 94.0 /100 | #104 | Exceptional 5.0% |
| Maltese | 94.0 /100 | #105 | Exceptional 5.0% |
| Immigrants | Romania | 93.7 /100 | #106 | Exceptional 5.0% |
| Immigrants | Turkey | 93.7 /100 | #107 | Exceptional 5.0% |
| Immigrants | Kuwait | 93.7 /100 | #108 | Exceptional 5.0% |
| Immigrants | Eritrea | 93.3 /100 | #109 | Exceptional 5.0% |