Comanche vs Mongolian Unemployment Among Seniors over 65 years
COMPARE
Comanche
Mongolian
Unemployment Among Seniors over 65 years
Unemployment Among Seniors over 65 years Comparison
Comanche
Mongolians
4.6%
UNEMPLOYMENT AMONG SENIORS OVER 65 YEARS
100.0/ 100
METRIC RATING
11th/ 347
METRIC RANK
5.1%
UNEMPLOYMENT AMONG SENIORS OVER 65 YEARS
59.8/ 100
METRIC RATING
168th/ 347
METRIC RANK
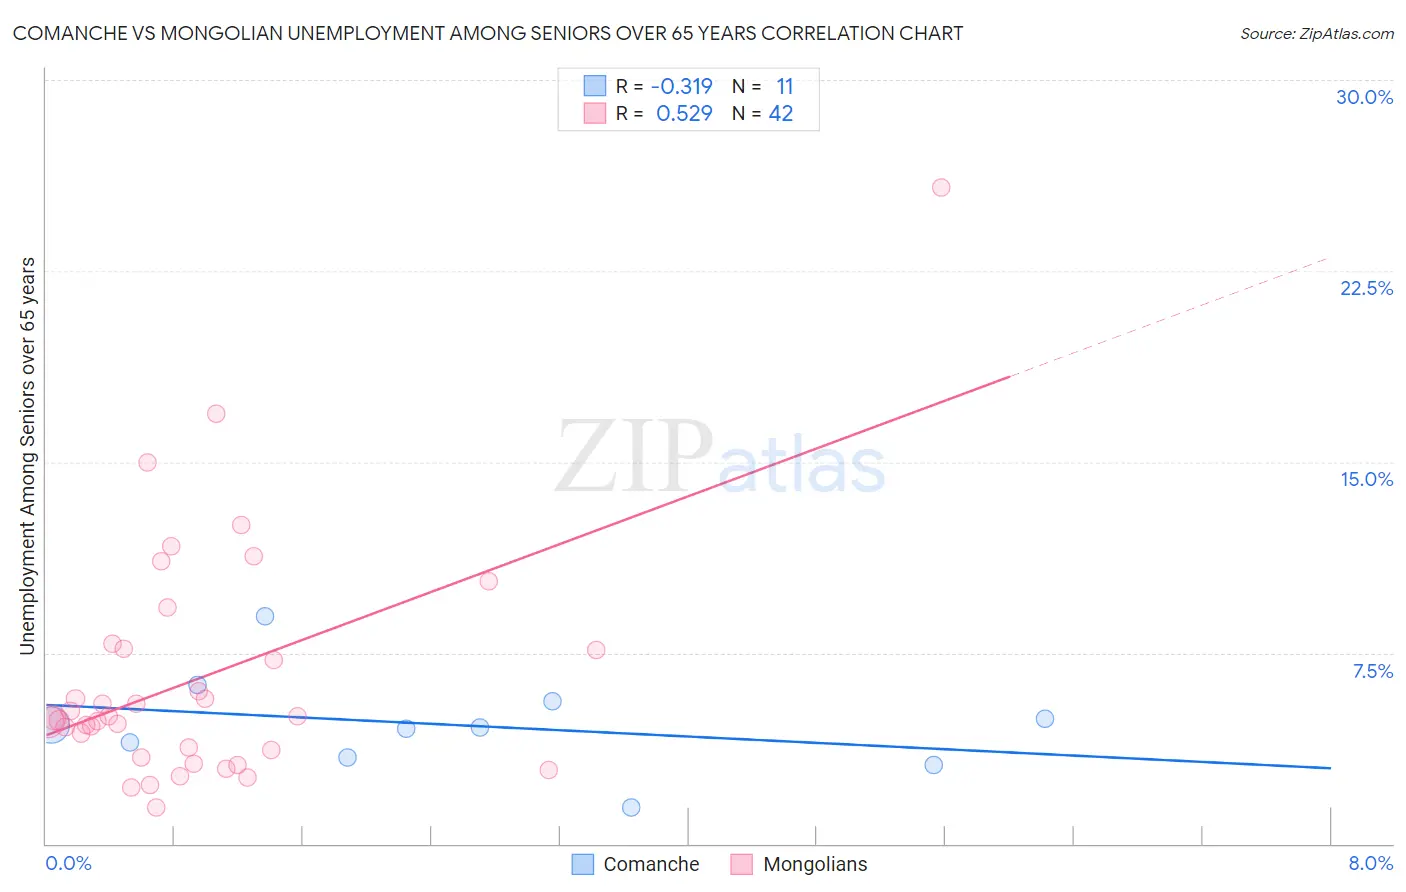
Comanche vs Mongolian Unemployment Among Seniors over 65 years Correlation Chart
The statistical analysis conducted on geographies consisting of 103,902,741 people shows a mild negative correlation between the proportion of Comanche and unemployment rate amomg seniors over the age of 65 in the United States with a correlation coefficient (R) of -0.319 and weighted average of 4.6%. Similarly, the statistical analysis conducted on geographies consisting of 135,223,533 people shows a substantial positive correlation between the proportion of Mongolians and unemployment rate amomg seniors over the age of 65 in the United States with a correlation coefficient (R) of 0.529 and weighted average of 5.1%, a difference of 12.4%.
Unemployment Among Seniors over 65 years Correlation Summary
| Measurement | Comanche | Mongolian |
| Minimum | 1.4% | 1.4% |
| Maximum | 9.0% | 25.8% |
| Range | 7.6% | 24.4% |
| Mean | 4.7% | 6.5% |
| Median | 4.5% | 5.0% |
| Interquartile 25% (IQ1) | 3.4% | 3.7% |
| Interquartile 75% (IQ3) | 5.6% | 7.7% |
| Interquartile Range (IQR) | 2.2% | 4.0% |
| Standard Deviation (Sample) | 1.9% | 4.7% |
| Standard Deviation (Population) | 1.8% | 4.6% |
Similar Demographics by Unemployment Among Seniors over 65 years
Demographics Similar to Comanche by Unemployment Among Seniors over 65 years
In terms of unemployment among seniors over 65 years, the demographic groups most similar to Comanche are Immigrants from Zaire (4.5%, a difference of 0.41%), Indonesian (4.5%, a difference of 0.42%), Osage (4.6%, a difference of 0.88%), Tsimshian (4.5%, a difference of 0.91%), and Cuban (4.6%, a difference of 0.98%).
| Demographics | Rating | Rank | Unemployment Among Seniors over 65 years |
| Sudanese | 100.0 /100 | #4 | Exceptional 4.4% |
| Chickasaw | 100.0 /100 | #5 | Exceptional 4.4% |
| Immigrants | Cuba | 100.0 /100 | #6 | Exceptional 4.5% |
| Immigrants | Congo | 100.0 /100 | #7 | Exceptional 4.5% |
| Tsimshian | 100.0 /100 | #8 | Exceptional 4.5% |
| Indonesians | 100.0 /100 | #9 | Exceptional 4.5% |
| Immigrants | Zaire | 100.0 /100 | #10 | Exceptional 4.5% |
| Comanche | 100.0 /100 | #11 | Exceptional 4.6% |
| Osage | 100.0 /100 | #12 | Exceptional 4.6% |
| Cubans | 100.0 /100 | #13 | Exceptional 4.6% |
| Menominee | 100.0 /100 | #14 | Exceptional 4.6% |
| Lumbee | 100.0 /100 | #15 | Exceptional 4.6% |
| Immigrants | Burma/Myanmar | 100.0 /100 | #16 | Exceptional 4.6% |
| Creek | 100.0 /100 | #17 | Exceptional 4.6% |
| Immigrants | Eritrea | 100.0 /100 | #18 | Exceptional 4.7% |
Demographics Similar to Mongolians by Unemployment Among Seniors over 65 years
In terms of unemployment among seniors over 65 years, the demographic groups most similar to Mongolians are Immigrants from Western Europe (5.1%, a difference of 0.020%), Lithuanian (5.1%, a difference of 0.050%), Immigrants from Laos (5.1%, a difference of 0.14%), Immigrants from Ukraine (5.1%, a difference of 0.15%), and Potawatomi (5.1%, a difference of 0.16%).
| Demographics | Rating | Rank | Unemployment Among Seniors over 65 years |
| Immigrants | Bosnia and Herzegovina | 66.1 /100 | #161 | Good 5.1% |
| Immigrants | South Eastern Asia | 65.6 /100 | #162 | Good 5.1% |
| Potawatomi | 64.5 /100 | #163 | Good 5.1% |
| Nepalese | 64.5 /100 | #164 | Good 5.1% |
| Immigrants | Ukraine | 64.2 /100 | #165 | Good 5.1% |
| Immigrants | Laos | 63.8 /100 | #166 | Good 5.1% |
| Immigrants | Western Europe | 60.4 /100 | #167 | Good 5.1% |
| Mongolians | 59.8 /100 | #168 | Average 5.1% |
| Lithuanians | 58.2 /100 | #169 | Average 5.1% |
| Immigrants | Eastern Asia | 54.9 /100 | #170 | Average 5.1% |
| Immigrants | Nonimmigrants | 54.1 /100 | #171 | Average 5.1% |
| Immigrants | Ireland | 53.2 /100 | #172 | Average 5.1% |
| Immigrants | Spain | 51.7 /100 | #173 | Average 5.1% |
| Spanish Americans | 50.0 /100 | #174 | Average 5.1% |
| Immigrants | Eastern Europe | 49.8 /100 | #175 | Average 5.1% |