Colville vs European 6th Grade
COMPARE
Colville
European
6th Grade
6th Grade Comparison
Colville
Europeans
97.4%
6TH GRADE
96.4/ 100
METRIC RATING
114th/ 347
METRIC RANK
98.0%
6TH GRADE
100.0/ 100
METRIC RATING
31st/ 347
METRIC RANK
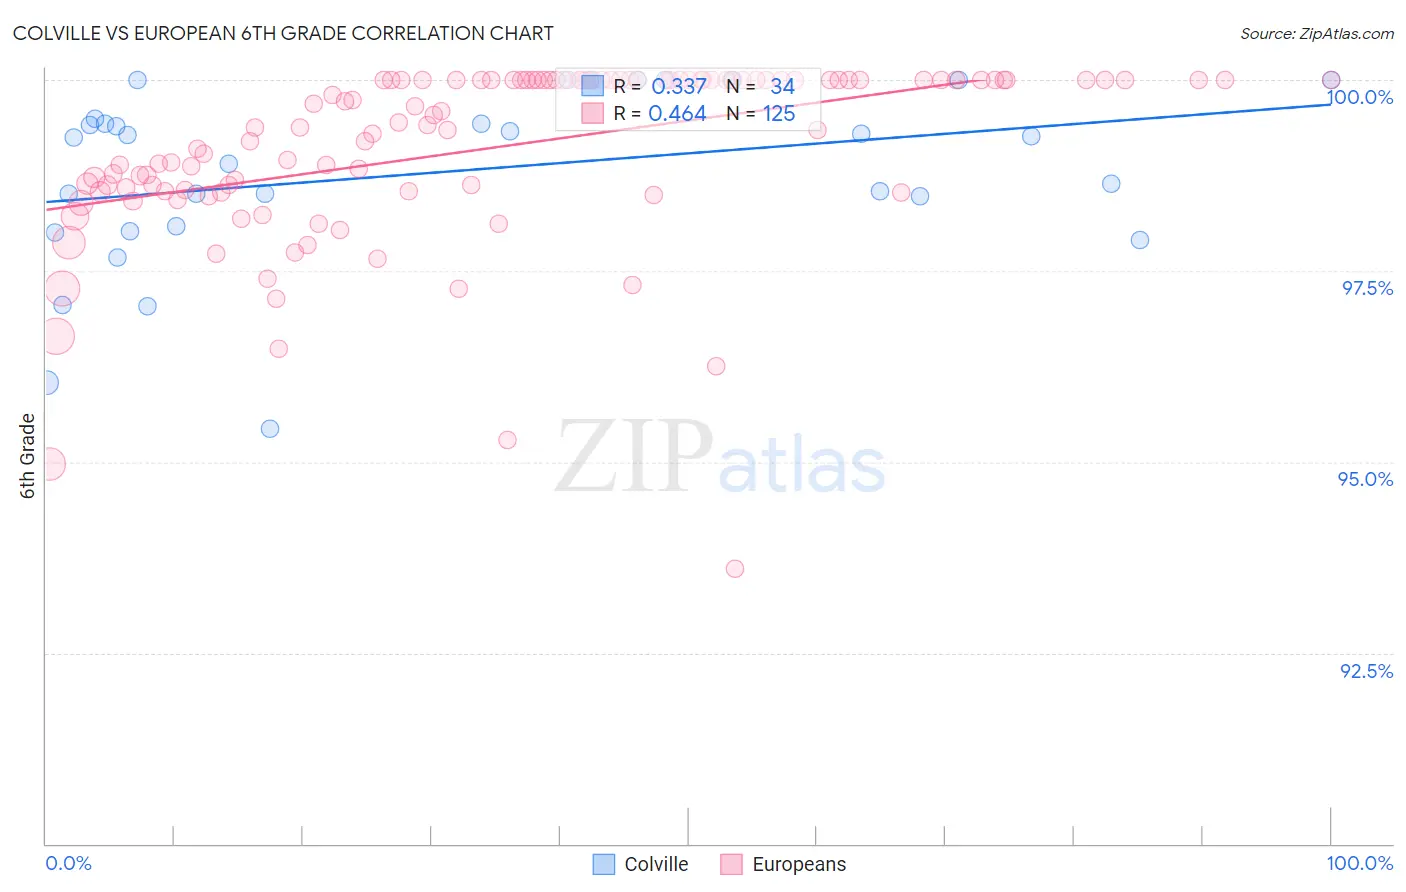
Colville vs European 6th Grade Correlation Chart
The statistical analysis conducted on geographies consisting of 34,681,972 people shows a mild positive correlation between the proportion of Colville and percentage of population with at least 6th grade education in the United States with a correlation coefficient (R) of 0.337 and weighted average of 97.4%. Similarly, the statistical analysis conducted on geographies consisting of 561,829,544 people shows a moderate positive correlation between the proportion of Europeans and percentage of population with at least 6th grade education in the United States with a correlation coefficient (R) of 0.464 and weighted average of 98.0%, a difference of 0.59%.
6th Grade Correlation Summary
| Measurement | Colville | European |
| Minimum | 95.4% | 93.6% |
| Maximum | 100.0% | 100.0% |
| Range | 4.6% | 6.4% |
| Mean | 98.8% | 99.1% |
| Median | 99.3% | 99.5% |
| Interquartile 25% (IQ1) | 98.1% | 98.5% |
| Interquartile 75% (IQ3) | 99.5% | 100.0% |
| Interquartile Range (IQR) | 1.4% | 1.5% |
| Standard Deviation (Sample) | 1.2% | 1.2% |
| Standard Deviation (Population) | 1.1% | 1.2% |
Similar Demographics by 6th Grade
Demographics Similar to Colville by 6th Grade
In terms of 6th grade, the demographic groups most similar to Colville are Immigrants from Saudi Arabia (97.4%, a difference of 0.0%), Immigrants from Latvia (97.4%, a difference of 0.010%), Thai (97.4%, a difference of 0.020%), Iroquois (97.4%, a difference of 0.020%), and Immigrants from Switzerland (97.4%, a difference of 0.020%).
| Demographics | Rating | Rank | 6th Grade |
| Immigrants | Singapore | 97.6 /100 | #107 | Exceptional 97.5% |
| Immigrants | Nonimmigrants | 97.3 /100 | #108 | Exceptional 97.4% |
| Immigrants | Czechoslovakia | 97.3 /100 | #109 | Exceptional 97.4% |
| Thais | 96.9 /100 | #110 | Exceptional 97.4% |
| Iroquois | 96.9 /100 | #111 | Exceptional 97.4% |
| Immigrants | Latvia | 96.7 /100 | #112 | Exceptional 97.4% |
| Immigrants | Saudi Arabia | 96.5 /100 | #113 | Exceptional 97.4% |
| Colville | 96.4 /100 | #114 | Exceptional 97.4% |
| Immigrants | Switzerland | 95.7 /100 | #115 | Exceptional 97.4% |
| Lebanese | 95.5 /100 | #116 | Exceptional 97.4% |
| Basques | 95.4 /100 | #117 | Exceptional 97.4% |
| Immigrants | Japan | 95.2 /100 | #118 | Exceptional 97.4% |
| Immigrants | Zimbabwe | 95.0 /100 | #119 | Exceptional 97.4% |
| Syrians | 94.8 /100 | #120 | Exceptional 97.4% |
| Immigrants | Norway | 94.7 /100 | #121 | Exceptional 97.4% |
Demographics Similar to Europeans by 6th Grade
In terms of 6th grade, the demographic groups most similar to Europeans are French Canadian (98.0%, a difference of 0.0%), Scandinavian (98.0%, a difference of 0.010%), French (98.0%, a difference of 0.010%), Alaska Native (98.0%, a difference of 0.010%), and Czech (98.0%, a difference of 0.020%).
| Demographics | Rating | Rank | 6th Grade |
| Croatians | 100.0 /100 | #24 | Exceptional 98.0% |
| Scotch-Irish | 100.0 /100 | #25 | Exceptional 98.0% |
| Czechs | 100.0 /100 | #26 | Exceptional 98.0% |
| Yup'ik | 100.0 /100 | #27 | Exceptional 98.0% |
| Scandinavians | 100.0 /100 | #28 | Exceptional 98.0% |
| French | 100.0 /100 | #29 | Exceptional 98.0% |
| French Canadians | 100.0 /100 | #30 | Exceptional 98.0% |
| Europeans | 100.0 /100 | #31 | Exceptional 98.0% |
| Alaska Natives | 100.0 /100 | #32 | Exceptional 98.0% |
| Chippewa | 100.0 /100 | #33 | Exceptional 97.9% |
| Swiss | 100.0 /100 | #34 | Exceptional 97.9% |
| Chinese | 100.0 /100 | #35 | Exceptional 97.9% |
| Italians | 100.0 /100 | #36 | Exceptional 97.9% |
| British | 100.0 /100 | #37 | Exceptional 97.9% |
| Belgians | 100.0 /100 | #38 | Exceptional 97.9% |