Colombian vs Paraguayan Unemployment Among Ages 20 to 24 years
COMPARE
Colombian
Paraguayan
Unemployment Among Ages 20 to 24 years
Unemployment Among Ages 20 to 24 years Comparison
Colombians
Paraguayans
10.4%
UNEMPLOYMENT AMONG AGES 20 TO 24 YEARS
22.3/ 100
METRIC RATING
198th/ 347
METRIC RANK
10.1%
UNEMPLOYMENT AMONG AGES 20 TO 24 YEARS
88.6/ 100
METRIC RATING
118th/ 347
METRIC RANK
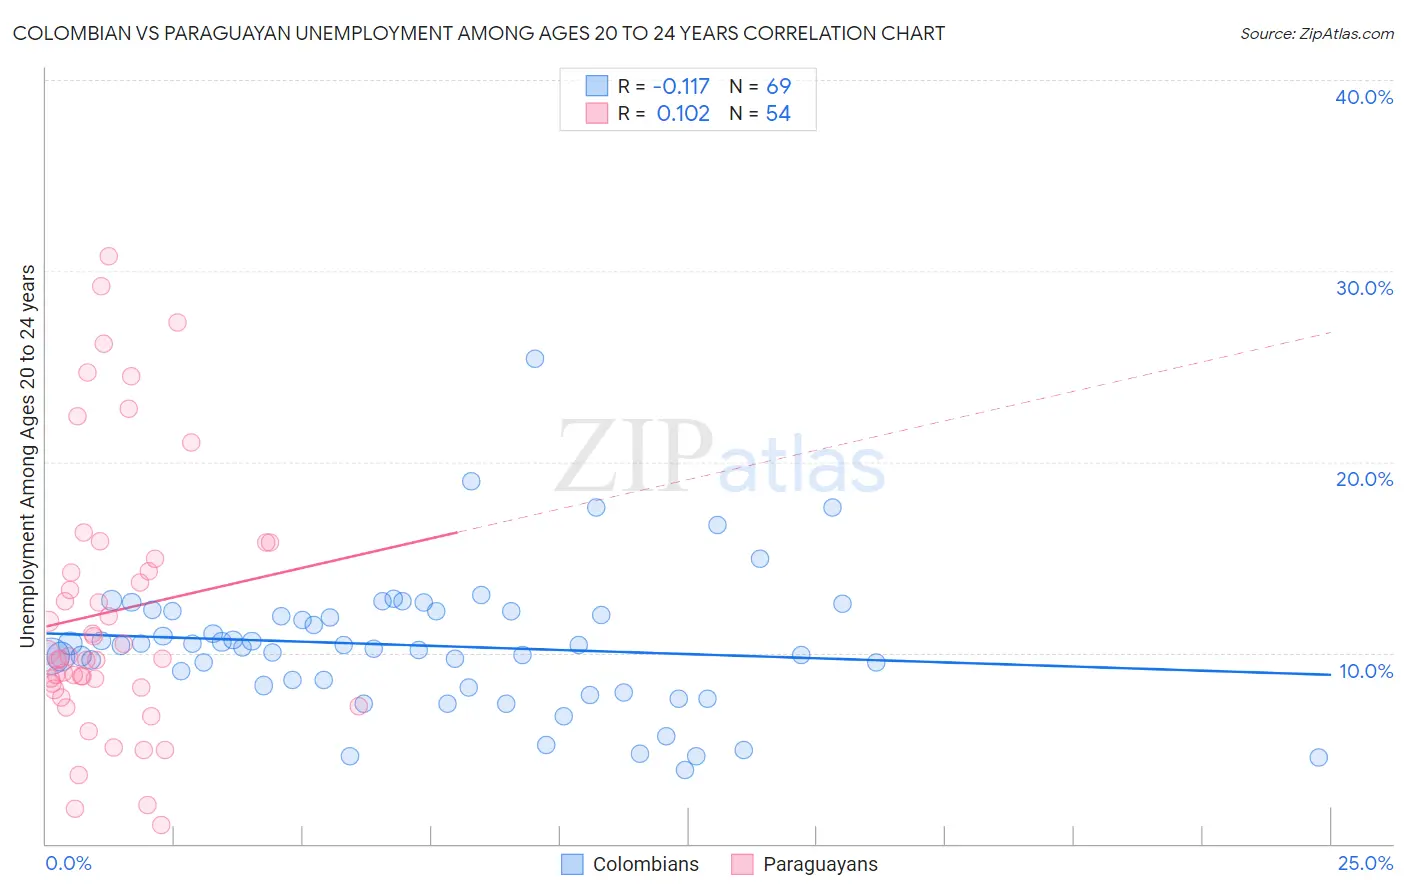
Colombian vs Paraguayan Unemployment Among Ages 20 to 24 years Correlation Chart
The statistical analysis conducted on geographies consisting of 407,071,658 people shows a poor negative correlation between the proportion of Colombians and unemployment rate among population between the ages 20 and 24 in the United States with a correlation coefficient (R) of -0.117 and weighted average of 10.4%. Similarly, the statistical analysis conducted on geographies consisting of 94,460,414 people shows a poor positive correlation between the proportion of Paraguayans and unemployment rate among population between the ages 20 and 24 in the United States with a correlation coefficient (R) of 0.102 and weighted average of 10.1%, a difference of 3.1%.
Unemployment Among Ages 20 to 24 years Correlation Summary
| Measurement | Colombian | Paraguayan |
| Minimum | 3.9% | 1.0% |
| Maximum | 25.4% | 30.8% |
| Range | 21.5% | 29.8% |
| Mean | 10.4% | 12.2% |
| Median | 10.4% | 9.8% |
| Interquartile 25% (IQ1) | 8.3% | 8.2% |
| Interquartile 75% (IQ3) | 12.2% | 14.9% |
| Interquartile Range (IQR) | 3.9% | 6.7% |
| Standard Deviation (Sample) | 3.6% | 7.0% |
| Standard Deviation (Population) | 3.6% | 7.0% |
Similar Demographics by Unemployment Among Ages 20 to 24 years
Demographics Similar to Colombians by Unemployment Among Ages 20 to 24 years
In terms of unemployment among ages 20 to 24 years, the demographic groups most similar to Colombians are Immigrants from Denmark (10.4%, a difference of 0.030%), Portuguese (10.4%, a difference of 0.030%), Russian (10.4%, a difference of 0.060%), Immigrants from Peru (10.4%, a difference of 0.060%), and Immigrants from Middle Africa (10.4%, a difference of 0.080%).
| Demographics | Rating | Rank | Unemployment Among Ages 20 to 24 years |
| Immigrants | Eastern Europe | 25.8 /100 | #191 | Fair 10.4% |
| Ugandans | 25.7 /100 | #192 | Fair 10.4% |
| Immigrants | Portugal | 25.3 /100 | #193 | Fair 10.4% |
| Immigrants | Italy | 25.0 /100 | #194 | Fair 10.4% |
| Egyptians | 24.5 /100 | #195 | Fair 10.4% |
| Immigrants | Philippines | 24.1 /100 | #196 | Fair 10.4% |
| Immigrants | Denmark | 22.8 /100 | #197 | Fair 10.4% |
| Colombians | 22.3 /100 | #198 | Fair 10.4% |
| Portuguese | 21.8 /100 | #199 | Fair 10.4% |
| Russians | 21.2 /100 | #200 | Fair 10.4% |
| Immigrants | Peru | 21.2 /100 | #201 | Fair 10.4% |
| Immigrants | Middle Africa | 20.9 /100 | #202 | Fair 10.4% |
| South Americans | 20.6 /100 | #203 | Fair 10.4% |
| Immigrants | Northern Europe | 19.5 /100 | #204 | Poor 10.4% |
| Cypriots | 18.9 /100 | #205 | Poor 10.4% |
Demographics Similar to Paraguayans by Unemployment Among Ages 20 to 24 years
In terms of unemployment among ages 20 to 24 years, the demographic groups most similar to Paraguayans are French (10.1%, a difference of 0.030%), Immigrants from Canada (10.1%, a difference of 0.040%), South African (10.1%, a difference of 0.070%), Immigrants from Uruguay (10.1%, a difference of 0.10%), and Basque (10.1%, a difference of 0.11%).
| Demographics | Rating | Rank | Unemployment Among Ages 20 to 24 years |
| Immigrants | Indonesia | 92.7 /100 | #111 | Exceptional 10.1% |
| Northern Europeans | 92.7 /100 | #112 | Exceptional 10.1% |
| German Russians | 92.4 /100 | #113 | Exceptional 10.1% |
| Ottawa | 90.8 /100 | #114 | Exceptional 10.1% |
| Immigrants | Morocco | 90.5 /100 | #115 | Exceptional 10.1% |
| Basques | 89.8 /100 | #116 | Excellent 10.1% |
| Immigrants | Uruguay | 89.6 /100 | #117 | Excellent 10.1% |
| Paraguayans | 88.6 /100 | #118 | Excellent 10.1% |
| French | 88.2 /100 | #119 | Excellent 10.1% |
| Immigrants | Canada | 88.2 /100 | #120 | Excellent 10.1% |
| South Africans | 87.8 /100 | #121 | Excellent 10.1% |
| Whites/Caucasians | 87.4 /100 | #122 | Excellent 10.1% |
| Immigrants | Iraq | 87.1 /100 | #123 | Excellent 10.1% |
| Immigrants | Japan | 86.5 /100 | #124 | Excellent 10.1% |
| Spanish | 86.1 /100 | #125 | Excellent 10.1% |