Colombian vs Immigrants from Nigeria Male Unemployment
COMPARE
Colombian
Immigrants from Nigeria
Male Unemployment
Male Unemployment Comparison
Colombians
Immigrants from Nigeria
5.2%
MALE UNEMPLOYMENT
81.1/ 100
METRIC RATING
133rd/ 347
METRIC RANK
6.0%
MALE UNEMPLOYMENT
0.0/ 100
METRIC RATING
269th/ 347
METRIC RANK
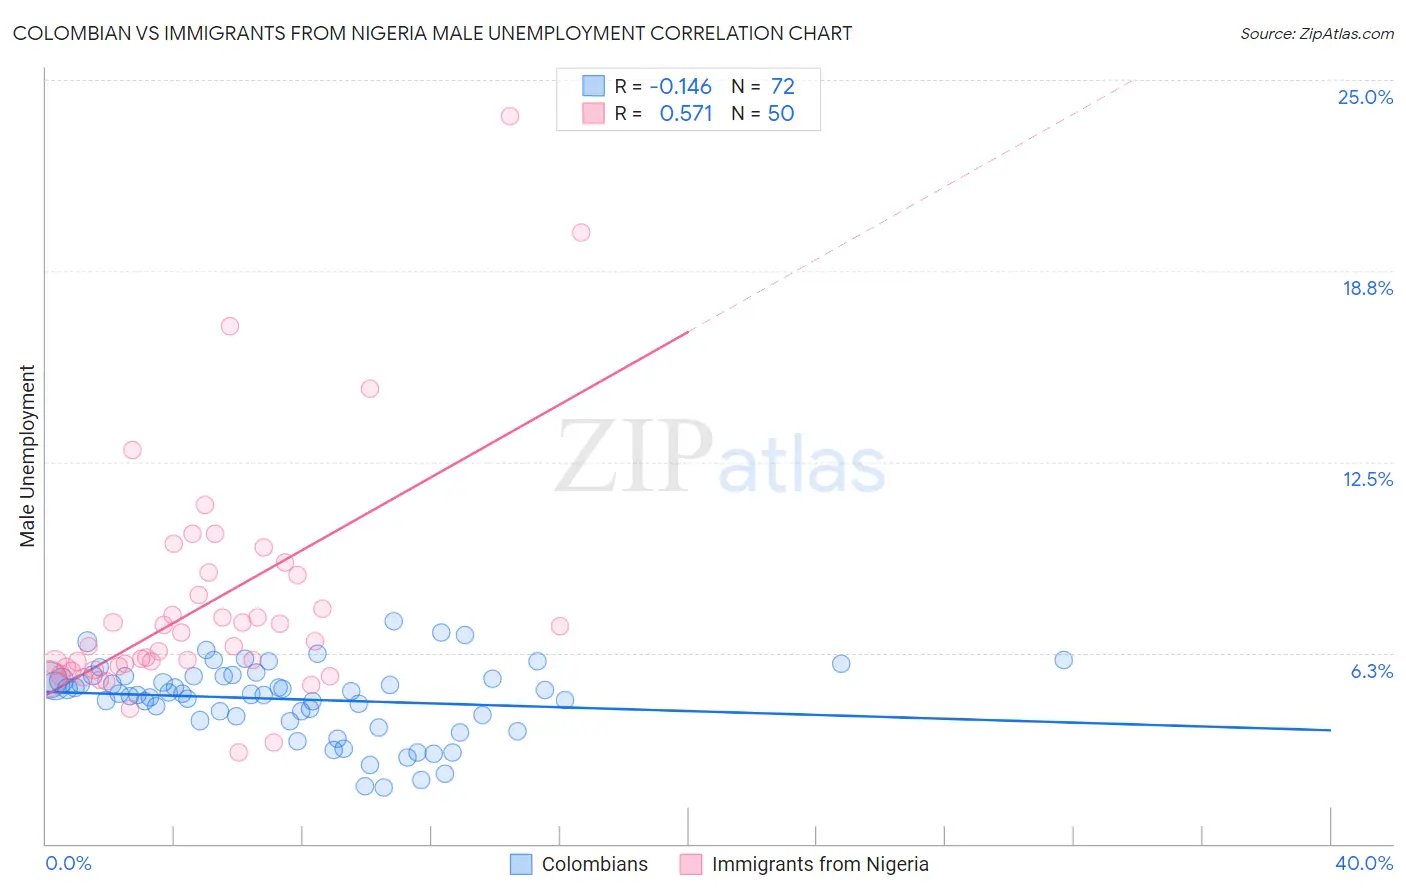
Colombian vs Immigrants from Nigeria Male Unemployment Correlation Chart
The statistical analysis conducted on geographies consisting of 417,848,253 people shows a poor negative correlation between the proportion of Colombians and unemployment rate among males in the United States with a correlation coefficient (R) of -0.146 and weighted average of 5.2%. Similarly, the statistical analysis conducted on geographies consisting of 282,980,898 people shows a substantial positive correlation between the proportion of Immigrants from Nigeria and unemployment rate among males in the United States with a correlation coefficient (R) of 0.571 and weighted average of 6.0%, a difference of 14.9%.
Male Unemployment Correlation Summary
| Measurement | Colombian | Immigrants from Nigeria |
| Minimum | 1.8% | 3.0% |
| Maximum | 7.3% | 23.8% |
| Range | 5.4% | 20.8% |
| Mean | 4.7% | 7.8% |
| Median | 4.9% | 6.6% |
| Interquartile 25% (IQ1) | 4.1% | 5.8% |
| Interquartile 75% (IQ3) | 5.5% | 8.8% |
| Interquartile Range (IQR) | 1.4% | 3.0% |
| Standard Deviation (Sample) | 1.2% | 3.9% |
| Standard Deviation (Population) | 1.2% | 3.9% |
Similar Demographics by Male Unemployment
Demographics Similar to Colombians by Male Unemployment
In terms of male unemployment, the demographic groups most similar to Colombians are Pakistani (5.2%, a difference of 0.060%), Immigrants from Saudi Arabia (5.2%, a difference of 0.090%), Lebanese (5.2%, a difference of 0.11%), Immigrants from Eastern Africa (5.2%, a difference of 0.12%), and Immigrants from Croatia (5.2%, a difference of 0.13%).
| Demographics | Rating | Rank | Male Unemployment |
| Immigrants | Colombia | 86.8 /100 | #126 | Excellent 5.1% |
| Immigrants | Brazil | 86.3 /100 | #127 | Excellent 5.2% |
| Hungarians | 85.1 /100 | #128 | Excellent 5.2% |
| Immigrants | Western Europe | 84.8 /100 | #129 | Excellent 5.2% |
| Immigrants | Malaysia | 83.5 /100 | #130 | Excellent 5.2% |
| Immigrants | Germany | 83.0 /100 | #131 | Excellent 5.2% |
| Chickasaw | 82.9 /100 | #132 | Excellent 5.2% |
| Colombians | 81.1 /100 | #133 | Excellent 5.2% |
| Pakistanis | 80.5 /100 | #134 | Excellent 5.2% |
| Immigrants | Saudi Arabia | 80.1 /100 | #135 | Excellent 5.2% |
| Lebanese | 79.9 /100 | #136 | Good 5.2% |
| Immigrants | Eastern Africa | 79.8 /100 | #137 | Good 5.2% |
| Immigrants | Croatia | 79.7 /100 | #138 | Good 5.2% |
| Kenyans | 79.4 /100 | #139 | Good 5.2% |
| Brazilians | 79.3 /100 | #140 | Good 5.2% |
Demographics Similar to Immigrants from Nigeria by Male Unemployment
In terms of male unemployment, the demographic groups most similar to Immigrants from Nigeria are Subsaharan African (6.0%, a difference of 0.13%), Bermudan (5.9%, a difference of 0.27%), Nigerian (5.9%, a difference of 0.48%), Bahamian (5.9%, a difference of 0.60%), and Blackfeet (6.0%, a difference of 0.64%).
| Demographics | Rating | Rank | Male Unemployment |
| Immigrants | Portugal | 0.1 /100 | #262 | Tragic 5.9% |
| Immigrants | Latin America | 0.1 /100 | #263 | Tragic 5.9% |
| Immigrants | Mexico | 0.0 /100 | #264 | Tragic 5.9% |
| French American Indians | 0.0 /100 | #265 | Tragic 5.9% |
| Bahamians | 0.0 /100 | #266 | Tragic 5.9% |
| Nigerians | 0.0 /100 | #267 | Tragic 5.9% |
| Bermudans | 0.0 /100 | #268 | Tragic 5.9% |
| Immigrants | Nigeria | 0.0 /100 | #269 | Tragic 6.0% |
| Sub-Saharan Africans | 0.0 /100 | #270 | Tragic 6.0% |
| Blackfeet | 0.0 /100 | #271 | Tragic 6.0% |
| Immigrants | Uzbekistan | 0.0 /100 | #272 | Tragic 6.0% |
| Armenians | 0.0 /100 | #273 | Tragic 6.0% |
| Immigrants | Sierra Leone | 0.0 /100 | #274 | Tragic 6.0% |
| Menominee | 0.0 /100 | #275 | Tragic 6.0% |
| Tlingit-Haida | 0.0 /100 | #276 | Tragic 6.0% |