Colombian vs Filipino Male Unemployment
COMPARE
Colombian
Filipino
Male Unemployment
Male Unemployment Comparison
Colombians
Filipinos
5.2%
MALE UNEMPLOYMENT
81.1/ 100
METRIC RATING
133rd/ 347
METRIC RANK
4.7%
MALE UNEMPLOYMENT
99.9/ 100
METRIC RATING
17th/ 347
METRIC RANK
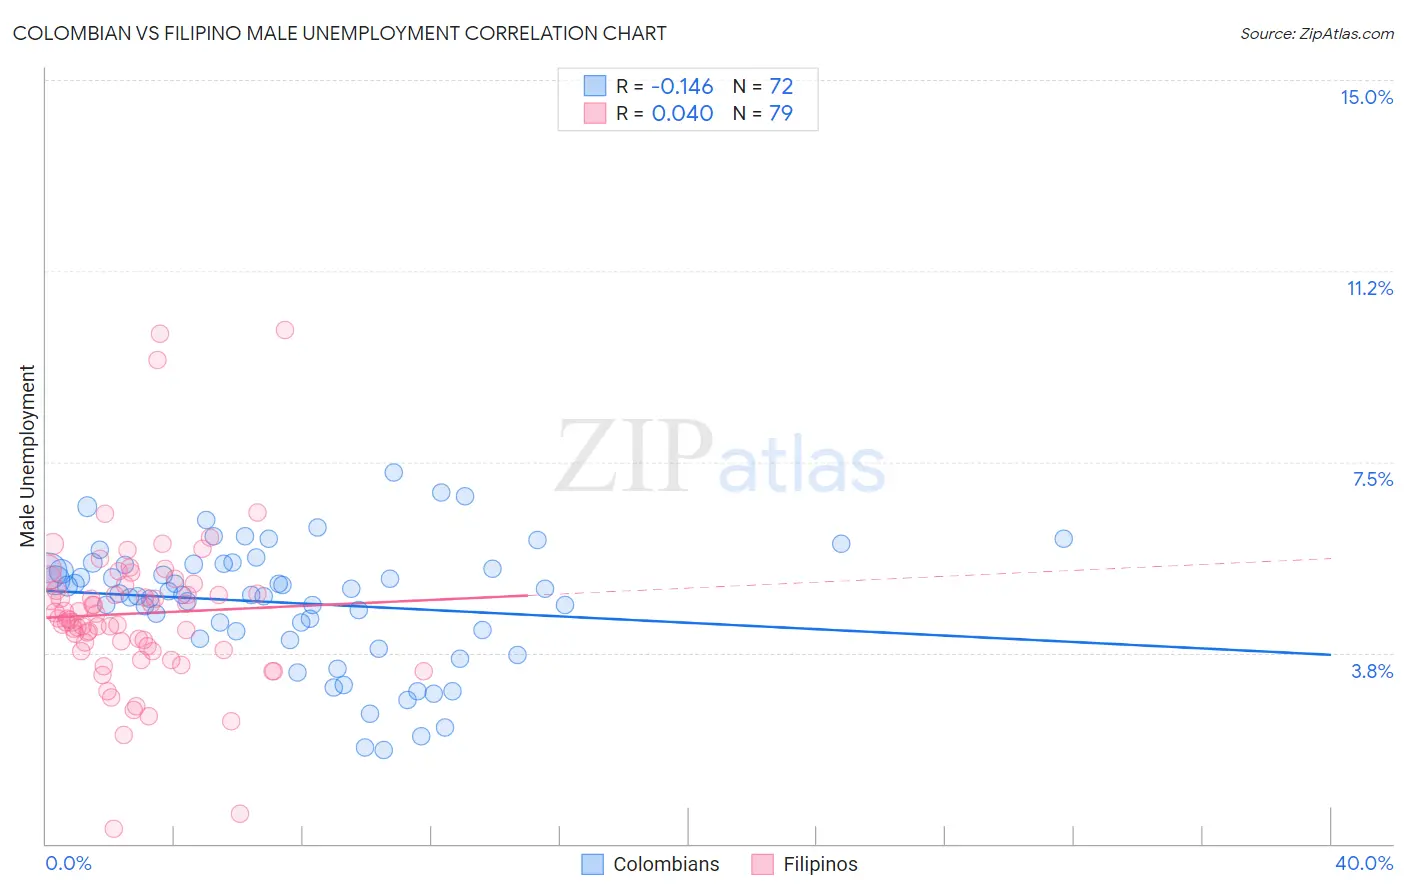
Colombian vs Filipino Male Unemployment Correlation Chart
The statistical analysis conducted on geographies consisting of 417,848,253 people shows a poor negative correlation between the proportion of Colombians and unemployment rate among males in the United States with a correlation coefficient (R) of -0.146 and weighted average of 5.2%. Similarly, the statistical analysis conducted on geographies consisting of 253,897,394 people shows no correlation between the proportion of Filipinos and unemployment rate among males in the United States with a correlation coefficient (R) of 0.040 and weighted average of 4.7%, a difference of 9.3%.
Male Unemployment Correlation Summary
| Measurement | Colombian | Filipino |
| Minimum | 1.8% | 0.30% |
| Maximum | 7.3% | 10.1% |
| Range | 5.4% | 9.8% |
| Mean | 4.7% | 4.5% |
| Median | 4.9% | 4.4% |
| Interquartile 25% (IQ1) | 4.1% | 3.8% |
| Interquartile 75% (IQ3) | 5.5% | 5.1% |
| Interquartile Range (IQR) | 1.4% | 1.3% |
| Standard Deviation (Sample) | 1.2% | 1.5% |
| Standard Deviation (Population) | 1.2% | 1.5% |
Similar Demographics by Male Unemployment
Demographics Similar to Colombians by Male Unemployment
In terms of male unemployment, the demographic groups most similar to Colombians are Pakistani (5.2%, a difference of 0.060%), Immigrants from Saudi Arabia (5.2%, a difference of 0.090%), Lebanese (5.2%, a difference of 0.11%), Immigrants from Eastern Africa (5.2%, a difference of 0.12%), and Immigrants from Croatia (5.2%, a difference of 0.13%).
| Demographics | Rating | Rank | Male Unemployment |
| Immigrants | Colombia | 86.8 /100 | #126 | Excellent 5.1% |
| Immigrants | Brazil | 86.3 /100 | #127 | Excellent 5.2% |
| Hungarians | 85.1 /100 | #128 | Excellent 5.2% |
| Immigrants | Western Europe | 84.8 /100 | #129 | Excellent 5.2% |
| Immigrants | Malaysia | 83.5 /100 | #130 | Excellent 5.2% |
| Immigrants | Germany | 83.0 /100 | #131 | Excellent 5.2% |
| Chickasaw | 82.9 /100 | #132 | Excellent 5.2% |
| Colombians | 81.1 /100 | #133 | Excellent 5.2% |
| Pakistanis | 80.5 /100 | #134 | Excellent 5.2% |
| Immigrants | Saudi Arabia | 80.1 /100 | #135 | Excellent 5.2% |
| Lebanese | 79.9 /100 | #136 | Good 5.2% |
| Immigrants | Eastern Africa | 79.8 /100 | #137 | Good 5.2% |
| Immigrants | Croatia | 79.7 /100 | #138 | Good 5.2% |
| Kenyans | 79.4 /100 | #139 | Good 5.2% |
| Brazilians | 79.3 /100 | #140 | Good 5.2% |
Demographics Similar to Filipinos by Male Unemployment
In terms of male unemployment, the demographic groups most similar to Filipinos are English (4.8%, a difference of 0.30%), European (4.8%, a difference of 0.32%), Pennsylvania German (4.8%, a difference of 0.38%), Immigrants from Taiwan (4.8%, a difference of 0.54%), and Carpatho Rusyn (4.8%, a difference of 0.55%).
| Demographics | Rating | Rank | Male Unemployment |
| Cubans | 100.0 /100 | #10 | Exceptional 4.6% |
| Swedes | 100.0 /100 | #11 | Exceptional 4.6% |
| Immigrants | Bolivia | 100.0 /100 | #12 | Exceptional 4.7% |
| Bolivians | 100.0 /100 | #13 | Exceptional 4.7% |
| Germans | 100.0 /100 | #14 | Exceptional 4.7% |
| Scandinavians | 100.0 /100 | #15 | Exceptional 4.7% |
| Swiss | 99.9 /100 | #16 | Exceptional 4.7% |
| Filipinos | 99.9 /100 | #17 | Exceptional 4.7% |
| English | 99.9 /100 | #18 | Exceptional 4.8% |
| Europeans | 99.9 /100 | #19 | Exceptional 4.8% |
| Pennsylvania Germans | 99.9 /100 | #20 | Exceptional 4.8% |
| Immigrants | Taiwan | 99.9 /100 | #21 | Exceptional 4.8% |
| Carpatho Rusyns | 99.9 /100 | #22 | Exceptional 4.8% |
| Tongans | 99.9 /100 | #23 | Exceptional 4.8% |
| Immigrants | South Central Asia | 99.9 /100 | #24 | Exceptional 4.8% |